The Hindu Rate of Growth, Reclaimed: India's Case for a New Economic Identity
A Whitepaper on Policy, Growth, and India's Rise in the Global Economic Order, 2014–2026

Summary
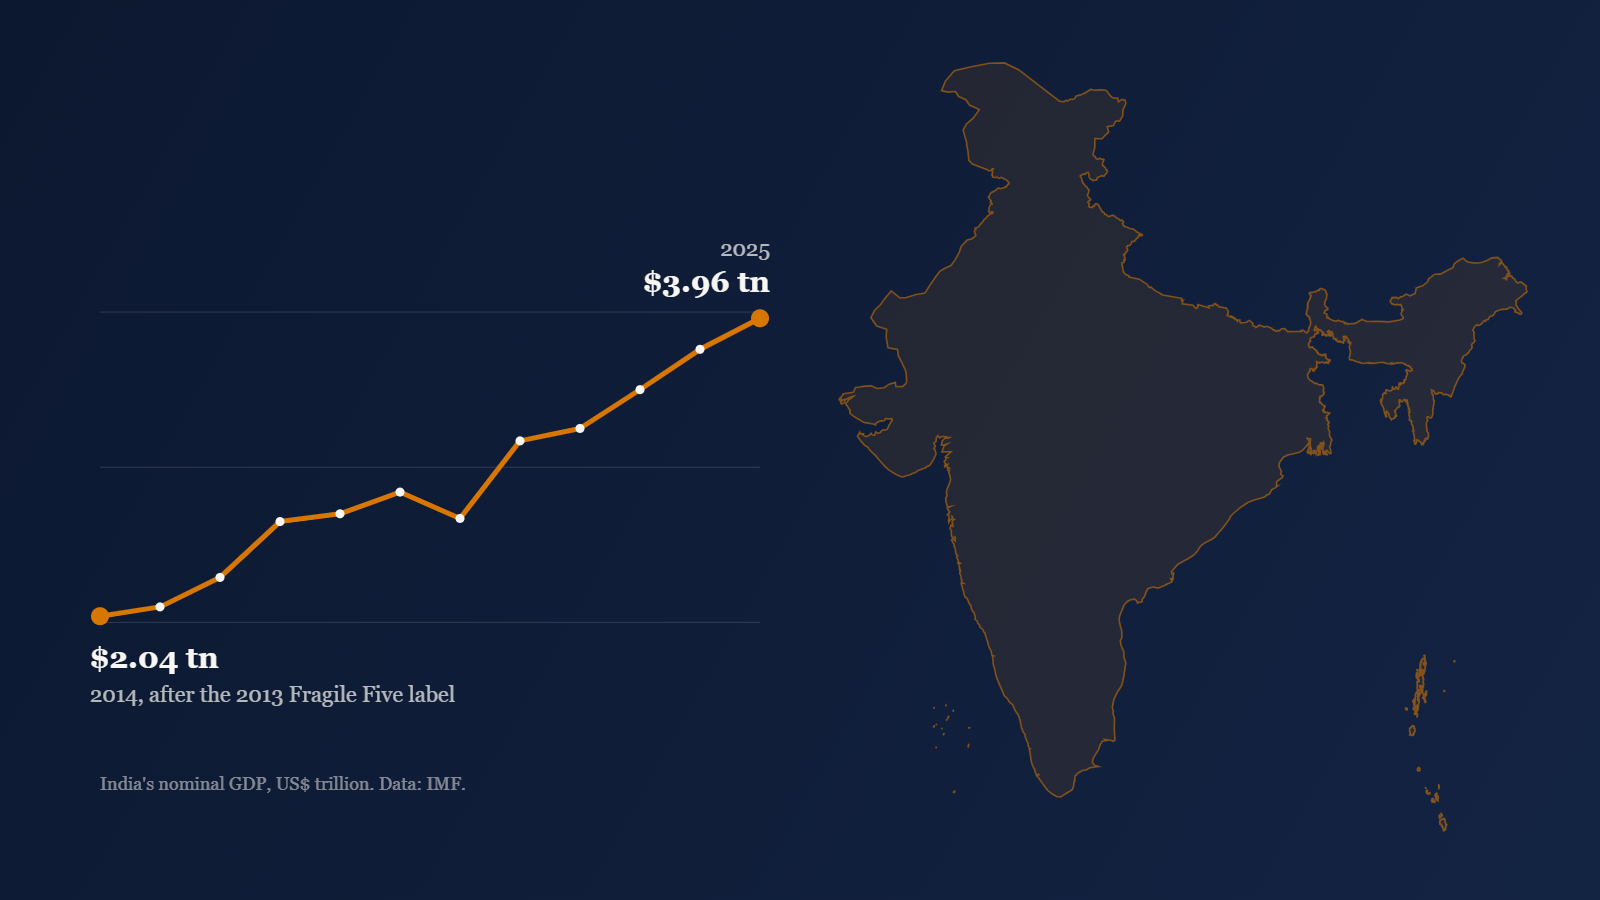
- —India moved from the "Fragile Five" in 2013 to the world's fourth-largest economy by nominal GDP in 2025.
- —The paper credits a reform architecture: the JAM trinity and Direct Benefit Transfer, UPI, GST, the Insolvency and Bankruptcy Code, and a 79-place rise in the World Bank's Ease of Doing Business ranking.
- —It cites market-generated measures, including the world's fourth-largest equity market and third-largest startup ecosystem, as evidence beyond government data.
- —It argues the phrase "Hindu Rate of Growth", coined in 1978 for growth of about 3.5%, should be reclaimed rather than retired, and lists the benchmarks still ahead, from overtaking Germany to a $55 trillion economy by 2047.
Executive Summary
Between 2014 and 2026, India's economy has moved from being labelled one of the "Fragile Five" emerging markets to becoming the world's fourth-largest economy by nominal GDP, and consistently the fastest-growing major economy on earth. This transformation has been underpinned by a distinctive policy architecture — the JAM trinity (Jan Dhan–Aadhaar– Mobile), Direct Benefit Transfer (DBT), the Unified Payments Interface (UPI), Demonetisation, Make in India, and an unprecedented public infrastructure build-out — layered on top of a series of large-scale welfare and beneficiary schemes, and reinforced by structural reforms including the Insolvency and Bankruptcy Code, the Goods and Services Tax, and a 79-place jump in the World Bank's Ease of Doing Business ranking. The same period has seen India's capital markets become the world's fourth-largest by market capitalisation and its startup ecosystem become the world's third-largest by unicorn count — independent, market-generated evidence that this reform architecture has translated into private capital formation, not government schemes alone. This paper traces that arc, benchmarks India's rise against the UK, Japan, and Germany, and examines the resilience of Indian growth through COVID-19 and subsequent global turmoil. It closes by considering the rhetorical case for retiring the old "Hindu Rate of Growth" epithet — coined by economist Raj Krishna in 1978 to describe India's anemic ~3.5% pre-liberalisation growth — and replacing it with a new connotation altogether, while noting the debate this reframing invites.
1. The Starting Point: India in 2014
In 2013–14, India was widely described by international investors as part of the "Fragile Five," alongside Brazil, Indonesia, South Africa, and Turkey — economies seen as vulnerable to capital flight, currency volatility, and twin deficits. India ranked around the 10th–11th largest economy in the world by nominal GDP. Financial inclusion was shallow: hundreds of millions of Indians had no bank account, subsidies leaked heavily through corruption and "ghost" beneficiaries, and digital payments were a rounding error in a cash-dominated economy.
This starting point is best understood against a longer historical arc, one economist Arvind Panagariya lays out in India Unlimited: Reclaiming the Lost Glory (2020) and revisits in The Nehru Development Model (2024). Drawing on Angus Maddison's historical GDP estimates, Panagariya notes that India accounted for roughly a quarter of world GDP as late as 1700, a share still near 16% by 1820, before colonial-era policy and the Industrial Revolution's shift of economic gravity toward the West drove that share down to around 5% by the time of Independence in 1947. Panagariya's central argument is that India's own post- Independence licensing regime then compounded this decline for a further four decades, delaying the return to prosperity that liberalisation eventually made possible — the same licensing regime, and the same period, that produced Raj Krishna's 1978 "Hindu Rate of Growth" diagnosis. This longer lens matters for the argument developed later in this paper: the case for reclamation rests not only on the post-2014 data, but on the historical claim that today's growth represents a return toward a share of global output India held for most of recorded economic history, rather than an unprecedented anomaly.
2. The Policy Architecture of the Decade
2.1 The JAM Trinity and Direct Benefit Transfer (DBT)
The Jan Dhan Yojana (2014) opened over 500 million no-frills bank accounts, which — linked to Aadhaar (biometric ID) and mobile numbers — created the "JAM trinity." This became the plumbing for Direct Benefit Transfer, allowing welfare payments (subsidies, pensions, scholarships) to move directly into beneficiaries' accounts, cutting out middlemen. The government has cited cumulative savings running into several lakh crore rupees from eliminated leakages and fake beneficiaries across schemes like the PDS (ration subsidies) and LPG (cooking gas) subsidies.
This claim does not rest on government self-reporting alone. The Brookings Institution India Center and its successor, the Centre for Social and Economic Progress (CSEP), independently assessed state-level capacity to deliver DBT through the JAM trinity in their study "Is India Ready to JAM?" — a household-level preparedness index rather than a top- down claim of success. That independent academic framing is itself a useful complement to the government's own figures: it treats JAM/DBT readiness as something that varies meaningfully by state and needs measuring, rather than assuming uniform success, which is precisely the kind of scrutiny a credible whitepaper should welcome rather than avoid.
The growth-first logic underlying DBT and the broader reform programme is grounded in earlier scholarship by Jagdish Bhagwati and Arvind Panagariya, whose India's Tryst with Destiny (2012) and Why Growth Matters (2013) argued systematically that sustained GDP growth — rather than redistribution alone — has historically been India's single most powerful instrument for poverty reduction, a thesis The Economist described as amounting to a manifesto for policymakers. DBT and JAM, on this reading, are not a departure from growth-first economics but its logical extension: using growth-enabled digital infrastructure to make redistribution efficient rather than treating growth and welfare delivery as competing priorities.
2.2 Demonetisation (2016)
In November 2016, the government withdrew ₹500 and ₹1,000 notes — about 86% of currency in circulation — overnight. The stated aims were to curb black money, counterfeit currency, and terror financing, and to push India toward formal, traceable, digital transactions. It remains the most contested measure of the decade: the near-term hit to informal-sector output and employment was significant, and the RBI later reported that nearly all demonetised currency returned to the banking system, undercutting the "black money extinguished" rationale. Its defenders argue it was the shock that catalysed the subsequent digital-payments boom and widened the tax base; critics call it a costly disruption with limited proven benefit. Both views are addressed further in Section 5.
2.3 UPI and the Digital Payments Revolution
Launched in April 2016 by the National Payments Corporation of India, UPI has become arguably India's most consequential public digital infrastructure project. From 373 transactions in its first month, UPI processed over 228 billion transactions worth nearly ₹300 lakh crore in calendar year 2025 alone, and crossed 24,000 crore (240+ billion) transactions in FY 2025–26, growing roughly 30% year-on-year. UPI now accounts for about 85% of India's digital payment volume and close to 49% of all real-time payment transactions globally — the IMF has formally recognised it as the world's largest retail fast- payment system by volume. It has been exported or referenced as a model in countries from Singapore to France to the UAE, turning what began as a domestic financial-inclusion tool into a soft-power asset.
2.4 Make in India and Manufacturing
Launched in September 2014, Make in India sought to lift manufacturing's share of GDP and position India as a global manufacturing alternative amid supply-chain diversification away from China. It was later reinforced by Production-Linked Incentive (PLI) schemes across electronics, semiconductors, pharmaceuticals, and defence. India has become a significant hub for smartphone assembly (including iPhones) and is investing heavily in building a domestic semiconductor ecosystem, though critics note manufacturing's GDP share has grown more slowly than the scheme's original targets.
2.5 PM Beneficiary Schemes
A suite of flagship welfare programmes has aimed to combine social protection with formalisation:
- —PM-KISAN: direct cash transfers to farmer households
- —Ayushman Bharat (PM-JAY): health insurance cover for lower-income households, described as the world's largest government-funded health assurance scheme
- —PM Awas Yojana: subsidised housing construction for the poor, urban and rural
- —Ujjwala Yojana: free LPG connections, aimed at reducing indoor pollution and easing the burden on women
- —PM Jan Dhan Yojana: universal banking access, discussed above
- —PM Mudra Yojana: collateral-free micro-loans to small/informal businesses
Collectively, the government presents these as the "welfare-to-formalisation" pipeline: bringing informal citizens and enterprises into the banked, taxed, and documented economy.
2.6 The Infrastructure Boom
Capital expenditure on physical infrastructure has risen sharply as a share of the union budget over the decade — highways, ports, airports, metro rail systems, and rural roads. National highway construction rates roughly doubled from early-2010s levels at their peak. Dedicated freight corridors, an expanding metro-rail footprint across dozens of cities, and large-scale renewable energy capacity additions have been positioned as long-term growth multipliers rather than short-term stimulus.
2.7 Structural and Institutional Reforms: EoDB, IBC, and GST
Alongside the digital and welfare architecture above, three legal and regulatory reforms are singled out by independent observers — rather than government sources alone — as the structural backbone of the decade:
- —The Ease of Doing Business ranking jump. On the World Bank's Doing Business index, India climbed from rank 142 in 2014 to rank 63 in 2019/2020 — a jump of 79 places in five years — and was recognised as one of the world's top-10 improvers for three consecutive years before the index's discontinuation in 2021. This is a notable data point precisely because it is an independent, third-party institutional assessment rather than a self-reported government statistic, making it harder to dismiss as promotional. The World Bank itself attributed the jump specifically to insolvency-law amendments, tax reforms, and improved access to credit.
- —The Insolvency and Bankruptcy Code (IBC), 2016. Widely regarded as one of the most significant structural reforms of the period, the IBC created a time-bound bankruptcy resolution process where none previously existed, giving secured creditors clearer priority in insolvency proceedings. The World Bank cited this specific reform as a direct driver of India's Ease of Doing Business improvement above.
- —The Goods and Services Tax (GST), 2017. Marketed as "one nation, one tax," GST replaced a fragmented patchwork of state-level indirect taxes with a unified national framework. Now with roughly eight years of track record, monthly GST collection figures — a real, independently trackable, and effectively non-manipulable data series — have shown a clear upward trend since implementation, and GST registration was itself cited by the World Bank as part of what made starting a business easier in India.
2.8 Capital Markets and the Startup Ecosystem
Two further, largely private-sector-driven indicators are worth highlighting because they are market-generated rather than government-reported data:
- —India's equity market becoming the world's 4th-largest. In January 2024, the combined market capitalisation of shares listed on Indian exchanges surpassed Hong Kong's for the first time, at roughly $4.33 trillion versus Hong Kong's $4.29 trillion — making India the fourth-largest equity market globally, behind only the US, China, and Japan. The two markets have since traded places on this ranking more than once as valuations moved, but India's structural climb — crossing $4 trillion in market capitalisation for the first time only in December 2023, with roughly half of that value added in the preceding four years alone — reflects a genuinely rapid expansion of domestic capital markets, driven by a growing retail investor base, sustained foreign portfolio inflows, and corporate earnings growth.
- —The startup and unicorn ecosystem. India has been consistently recognised — including in its own Economic Survey — as the world's third-largest startup ecosystem, behind only the United States and China, having overtaken the United Kingdom in unicorn count in 2021–22. India crossed the 100-unicorn mark in May 2022, with total unicorn valuations exceeding $330 billion at that milestone and over 110 unicorns recognised by early 2025. This is meaningful as complementary evidence to the digital-infrastructure story above: it shows the JAM/UPI/GST reform architecture translating into private venture capital formation and enterprise creation, not solely into government-administered schemes.
3. India's Rise in the Global Rankings
By nominal GDP, India's climb has been rapid:
- —Overtook France: ~2021–22
- —Overtook the United Kingdom (became 5th largest): September 2022
- —Overtook Japan (became 4th largest): 2025 (IMF data; officially confirmed by India's government in its December 2025 year-end economic review, pending final 2026 data confirmation)
- —Projected to overtake Germany (3rd largest): Projected ~2028, per IMF/Morgan Stanley estimates
As of the IMF's most recent projections, India's nominal GDP was estimated at roughly $4.19–4.5 trillion, narrowly ahead of Japan, with only the United States, China, and Germany larger. It's worth noting this "overtaking Japan" claim has also drawn pushback: some economists (including former Indian officials) have argued that on the government's own 2024–25 GDP data, India's economy was still slightly behind Japan's, and that the overtaking narrative got ahead of confirmed data — a reminder that these rankings shift with exchange rates and are often provisional until finalised.
On growth rate, India has been the standout among large economies: the IMF has repeatedly projected India as the only major economy growing above 6% annually through 2025–2026, well ahead of the US, China, the Eurozone, and Japan (the latter growing well under 1%). This growth has persisted despite:
- —The COVID-19 pandemic, which caused a sharp contraction in FY2020–21 followed by a strong statistical and real rebound;
- —Global monetary tightening and inflation following 2022;
- —The Russia-Ukraine war's effects on energy and commodity prices;
- —More recently, steep US tariffs imposed in 2025 over India's continued purchases of Russian oil — a headwind India's own economic review described itself as navigating through "resilience amid persistent global trade uncertainties."
4. Structural Resilience
Several structural features are credited with underpinning this resilience:
- —A large, consumption-driven domestic market that is less exposed to any single external shock than smaller trade-dependent economies;
- —Record-high foreign exchange reserves providing a buffer against currency and external-account stress;
- —A rapidly digitising financial system (UPI, DBT, e-KYC) that improved crisis-time targeting of relief, notably food and cash transfers during COVID-19 lockdowns;
- —Diversification of global manufacturing and supply chains ("China+1") drawing investment toward India;
- —A young, large workforce (demographic dividend) relative to aging peers like Japan, China, and much of Europe.
5. Completing the Identity: Benchmarks Ahead
A reclaimed economic identity is not asserted in a single milestone; it is completed benchmark by benchmark. The items below are the specific, named markers by which the new identity this paper argues for — scale, formalisation, digital infrastructure — is still being built out, not evidence that the identity has yet to be earned.
Former Chief Economic Advisor Krishnamurthy Subramanian's India@100: Envisioning Tomorrow's Economic Powerhouse (2024) offers the most concrete published attempt at quantifying this trajectory: he projects that sustained 8% real growth combined with roughly 5% inflation would double India's nominal GDP roughly every six years, taking it from around $3.25 trillion in 2023 to a $55 trillion economy by 2047 — India's centennial year. Subramanian frames this on four pillars: a macroeconomic emphasis on growth, microeconomic focus on social and economic inclusion, an emphasis on what he terms "ethical wealth creation," and a private-investment-led virtuous cycle. It is worth noting this figure is considerably more optimistic than most independent projections, which tend to cluster in the $25–30 trillion range for 2047 (Goldman Sachs and EY among them) — a reminder that even sympathetic, well-credentialed forecasts of India's trajectory span a wide range, and the benchmarks below should be read as markers on a path whose ultimate distance remains genuinely disputed among economists.
- —Economy size. Benchmark: overtake Germany to become the 3rd-largest economy. Status: targeted for ~2028 (IMF/Morgan Stanley); on the current growth differential with Germany, this is the next milestone in sequence after Japan.
- —Manufacturing share of GDP. Benchmark: Make in India's original ambition of ~25% of GDP. Status: PLI-driven capacity in semiconductors, electronics, and defence is mid-build; share is expected to move as recently sanctioned plants reach production scale over the next several years.
- —Per-capita income. Benchmark: convergence toward upper-middle-income status. Status: function of sustained aggregate growth continuing to compound; tracked as the natural next stage once the current growth rate is sustained through the decade.
- —Formal employment. Benchmark: extending JAM/DBT-style formalisation from welfare and payments into labour markets. Status: e-Shram registration, gig-worker social security frameworks, and PLI-linked factory jobs are the current instruments; scaling these to match UPI's formalisation of payments is the benchmark.
- —UPI internationalisation. Benchmark: extend UPI's ~49% share of global real-time payment volume into cross-border acceptance. Status: bilateral UPI linkages already live with several countries; expanding merchant acceptance abroad is the next phase NPCI and RBI have stated they are pursuing.
- —Statistical infrastructure. Benchmark: match survey and tax-data granularity to the pace of formalisation. Status: Aadhaar- and DBT-linked data integration is progressively improving the precision of income, employment, and inequality measurement used to track the benchmarks above.
- —Long-run GDP scale. Benchmark: Subramanian's $55 trillion by 2047 (India@100); more conservative independent estimates cluster near $25–30 trillion. Status: contingent on sustaining 8% real growth for two decades — a materially higher bar than the ~6% averaged so far, making this the most stretch-target benchmark in this table.
Read this way, Section 5 is not a list of shortfalls set against the thesis — it is the unfinished portion of the same identity whose foundation (JAM, DBT, UPI, the Japan crossover) is documented in Sections 1–4. The benchmarks above are the markers by which that identity moves from reclaimed-in-argument to reclaimed-in-full.
6. Conclusion: Beyond the "Hindu Rate of Growth"
In 1978, economist Raj Krishna coined the phrase "Hindu Rate of Growth" to describe India's chronically slow ~3.5% annual GDP growth during the license-raj decades — a term intended less as a comment on religion than as a wry, and in retrospect widely criticised, shorthand for a stagnant, overregulated economy. The phrase stuck for decades as a byword for India's underperformance relative to its potential and its East Asian peers.
The thesis of this paper is that the "Hindu Rate of Growth" should not simply be discarded but reclaimed — taken back from its 1978 meaning and re-anchored to the identity India has since built for itself. This is, in substance, the same argument Arvind Panagariya makes at book length in India Unlimited: Reclaiming the Lost Glory — that India's task is not to invent a new economic identity from nothing, but to recover the global economic standing (a quarter of world GDP as late as 1700, still 16% in 1820) that colonial extraction and then its own post-Independence licensing regime eroded to roughly 5% by 1947 and further still by the time Raj Krishna coined his phrase in 1978. Economist M. Govinda Rao's review of that book captured the same arc in a single image, describing India's necessary transformation as one "from the lumbering elephant to a charging tiger" — a phrase this paper adopts as a fitting shorthand for what "reclamation" means in practice, taking the same reform architecture (JAM, DBT, UPI, IBC, GST) as the mechanism by which the charge is being made. Raj Krishna's phrase captured a specific, measurable reality of its era: roughly 3.5% average annual GDP growth sustained across the 1950s–1980s, a rate below population growth in per-capita terms, produced by a licensing regime that rationed capacity, capital, and enterprise rather than allocating them by market signal. That reality no longer exists, and neither does the identity it implied — an economy defined by scarcity, bureaucratic gatekeeping, and stagnation. The India of 2014–2026 has averaged growth close to double Krishna's benchmark even through a global pandemic, has climbed from the 11th- to the 4th-largest economy in nominal terms in little over a decade, and has built, in UPI, a payments architecture that now clears more real-time transactions than any other nation on earth. These are not incidental statistics; they are the raw material of a new national economic identity — one defined by scale, formalisation, and digital infrastructure rather than by rationing and delay.
Reclamation, not deletion, is the deliberate choice this paper makes. Deleting the phrase would treat it as an embarrassment best forgotten; reclaiming it turns the same words into a marker of how far the distance travelled actually is — the sharper the original meaning, the more forceful the inversion. The JAM trinity, DBT, UPI, and the infrastructure build-out documented throughout this paper are not isolated success stories layered on top of an otherwise unchanged growth ceiling; together they constitute the structural break that gives a reclaimed identity its substance. If the phrase "Hindu Rate of Growth" is to remain part of the economic lexicon at all, it should now denote what Section 5's benchmarks describe: sustained 6%+ growth, a manufacturing and payments infrastructure other nations study and import, and a rising share of global GDP moving toward the benchmarks still ahead. The case this paper makes is that India has already earned the right to redefine the term on its own terms — the work still in progress, mapped in Section 5, is precisely the process by which that new identity is being completed rather than merely claimed.
Literature and Further Reading
The scholarship engaged with directly in this paper's argument — Panagariya's reclamation framing, Bhagwati and Panagariya's growth-first thesis, Subramanian's $55-trillion projection, and the Brookings/CSEP independent JAM assessment — is cited in place above. The following additional sources informed the broader research base:
- —M. Govinda Rao, "Agenda for Transforming the Lumbering Elephant to a Charging Tiger," Indian Public Policy Review, 2020, 1(2): 59–61.
- —IMF Fintech Note 2025/004, Alexander Copestake, Divya Kirti & Maria Soledad Martinez Peria, "Growing Retail Digital Payments: The Value of Interoperability" (June 2025) — the primary IMF staff research underlying this paper's UPI figures.
- —ACI Worldwide & GlobalData, "It's Prime Time for Real-Time 2024" — the source of the ~49% global real-time payment volume share cited for UPI.
- —Sanjeev Sanyal (EAC-PM), "Relative Economic Performance of Indian States: 1960–61 to 2023–24."
This paper synthesises IMF World Economic Outlook data, RBI and NPCI payment-system reports, World Bank Doing Business data, Bloomberg market-capitalisation data, and Indian government economic reviews current as of early-to-mid 2026, alongside published critiques and scholarship from Indian and international economists. Figures such as GDP rankings, crossover dates, and equity-market rankings are provisional and subject to revision as underlying data is finalised.
Sourav Chakraborty is an entrepreneur, Indian history researcher, political observer and columnist. An alumnus of Imperial College London and Boston University, he holds the DIC, FRSA, FRAS, CEng (IET & IEI) and CMgr (MCMI).
The views expressed in this piece are the author's own. Global Outlook publishes contributed opinion as a platform and does not necessarily endorse it.
More from Trade & Finance
India's Labour Data Has No Category for Gig Workers
Gig workers are now covered by the Code on Social Security, yet the PLFS, e-Shram and Census 2027 do not identify platform work. Four changes would fix that.
24 Sept 2026The Fading Force of American Tariffs on China
Weeks after China tightened rare-earth licensing in 2025, a Ford plant stopped. Xi Jinping arrives in Washington with the same licensing rules still in force.
13 Sept 2026An Optimistic Look at India's Credit Upgrade and its Limited Signal
Japan's rating agency lifted India to A- on steady growth, even as AI-driven job losses, militarised borders and urban protests test citizen sentiments.