The End of the Cartel Century: OPEC, Russian Crude, US Shale and India's Refining Pivot
A Research White Paper on the Geopolitics of the Global Oil Transition

Summary
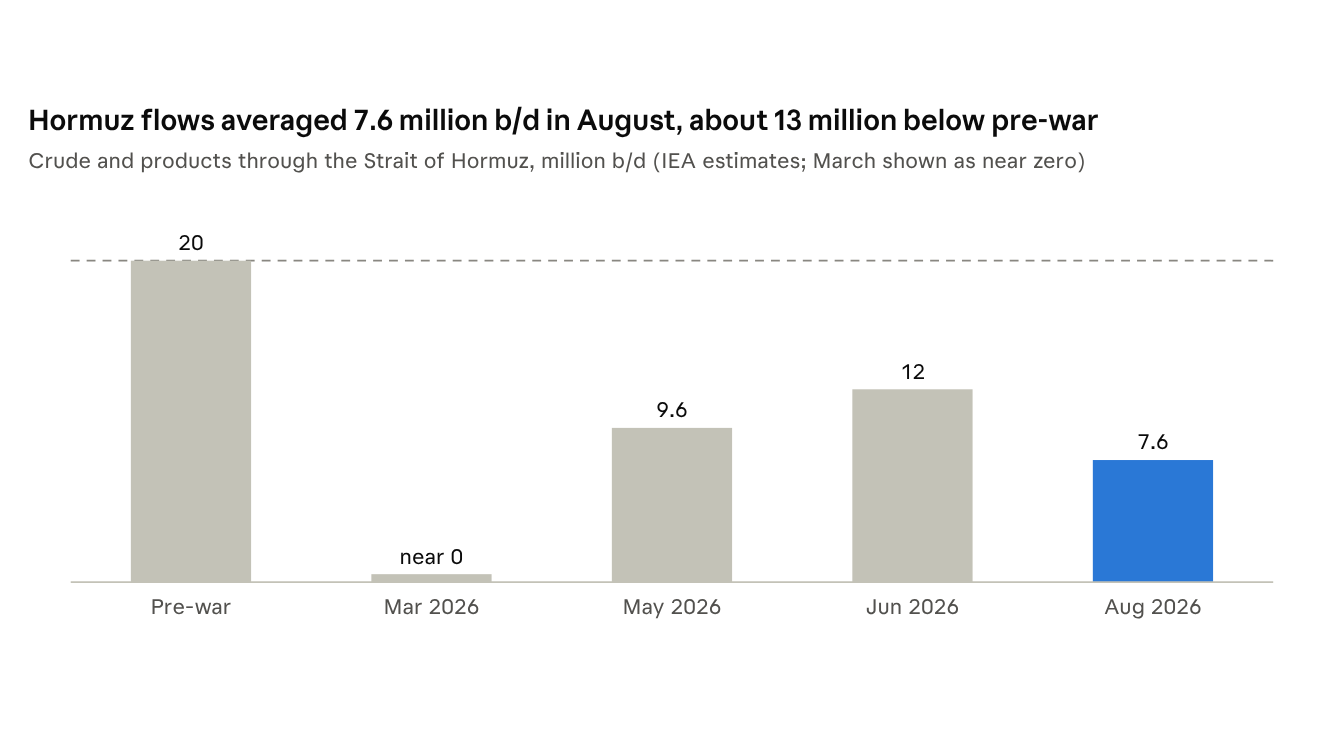
- —OPEC's pricing power is structurally weaker than at any point since 1973. The US-Israeli war on Iran, which began on 28 February 2026, choked Hormuz flows from about 20 million b/d to almost zero; the UAE left OPEC and OPEC+ on 1 May 2026; and OPEC+ quota increases this year stayed largely on paper.
- —The US is now the system's swing supplier. US crude output averaged a record 13.6 million b/d in 2025, about 40% above Russia or Saudi Arabia, and the EIA forecasts a record 13.8 million b/d in 2026.
- —Russian oil has been rerouted, not removed. Price caps were lowered to $44.10/bbl from February 2026, yet 60% of Russia's seaborne oil moved on sanctioned shadow tankers in October 2026.
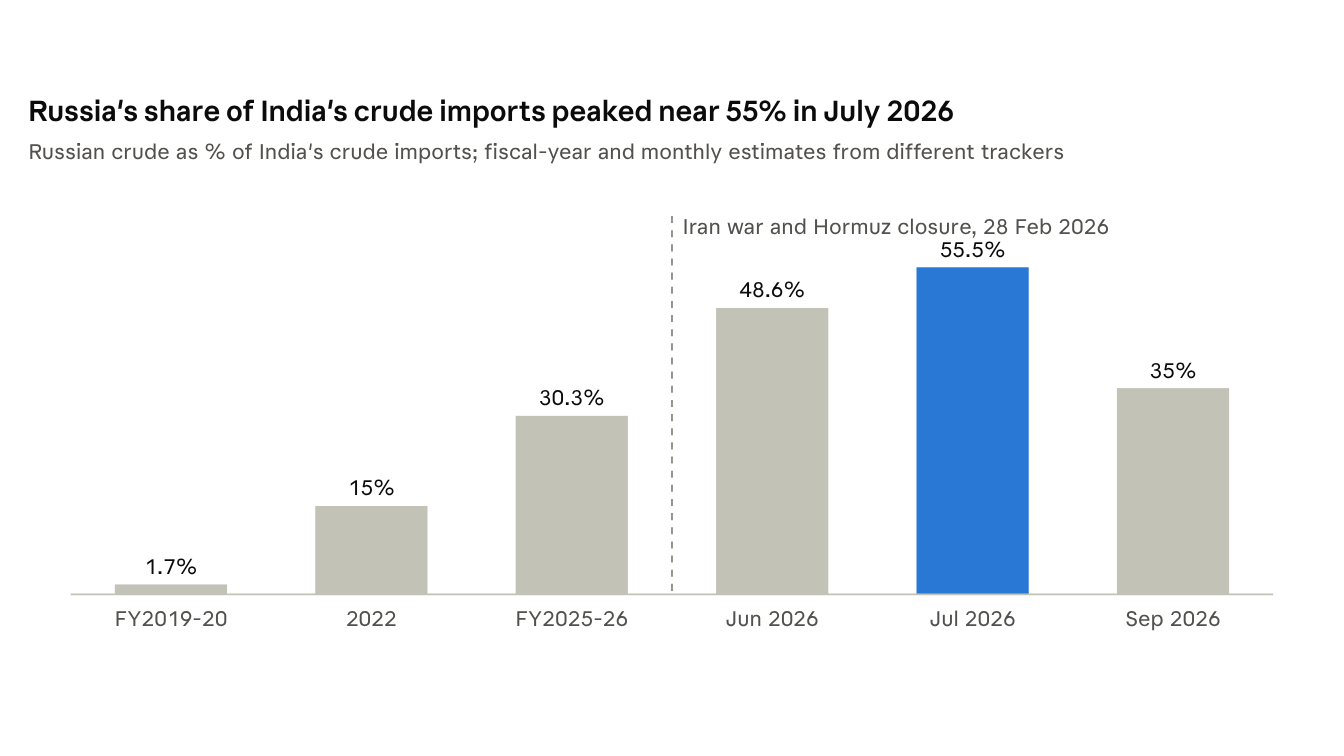
- —India's Russian intake is a function of crisis, not ideology. India pledged in February 2026 to stop buying Russian oil in return for an 18% US tariff. After Hormuz closed, Russian crude rose to a record 2.8 million b/d, about 55% of imports, in July 2026, aided by US waivers.
- —Jamnagar is India's strategic asset. Its segregated export refinery keeps EU and US product markets open; its heavy-crude cokers have made India the largest destination for post-Maduro Venezuelan oil.
Executive summary
OPEC no longer sets the world oil price; in 2026 it lost both its physical grip (the Strait of Hormuz) and its institutional cohesion (the UAE's exit). The market that replaces it is multipolar: US shale supplies the marginal barrel, Russia sells through a shadow fleet outside Western rules, and sanctions policy in Washington now moves more oil than quota policy in Vienna.
India sits at the hinge of this system. As the world's third-largest crude importer, it buys from all three poles, and through Reliance's 1.4 million b/d Jamnagar complex it converts sanctioned, discounted or stranded crude into fuels the West still needs.
Key findings
- —1. OPEC's pricing power is structurally weaker than at any point since 1973. The US-Israeli war on Iran, which began on 28 February 2026, choked Hormuz flows from about 20 million b/d to almost zero; the UAE left OPEC and OPEC+ on 1 May 2026; and OPEC+ quota increases this year stayed largely on paper.
- —2. The US is now the system's swing supplier. US crude output averaged a record 13.6 million b/d in 2025, about 40% above Russia or Saudi Arabia, and the EIA forecasts a record 13.8 million b/d in 2026.
- —3. Russian oil has been rerouted, not removed. Price caps were lowered to $44.10/bbl from February 2026, yet 60% of Russia's seaborne oil moved on sanctioned shadow tankers in October 2026.
- —4. India's Russian intake is a function of crisis, not ideology. India pledged in February 2026 to stop buying Russian oil in return for an 18% US tariff. After Hormuz closed, Russian crude rose to a record 2.8 million b/d, about 55% of imports, in July 2026, aided by US waivers.
- —5. Jamnagar is India's strategic asset. Its segregated export refinery keeps EU and US product markets open; its heavy-crude cokers have made India the largest destination for post-Maduro Venezuelan oil.
Bottom line for India: keep optionality across Russia, the Americas and the Gulf, and treat refining complexity, storage and payment channels as instruments of foreign policy.
Introduction and analytical framework
This paper traces how OPEC's grip on the oil market has loosened from the first oil shock of 1973 to the multipolar market of 2026. It sets out an analytical framework, applies it to the major price episodes of 1973–2018, and then turns to the forces reshaping the market today. Its central argument is that demand shocks from the business cycle dominate oil-price formation, that endogenous capacity cycles matter more than headline geopolitics, and that OPEC's power has been contextual and largely confined to price stabilisation since the 1980s glut [3], [4].
We use a four-way classification of shocks, drawn from Kilian, Baumeister, Fattouh and Economou [1]–[3]:
- —Exogenous flow-supply shock. Mechanism: Political events cut output in producing countries. 2026 example: Iran war closes Hormuz from 28 Feb 2026
- —Endogenous supply shock. Mechanism: Over- or under-investment changes capacity relative to expected demand. 2026 example: US shale and offshore growth; UAE capacity build-out
- —Flow-demand shock. Mechanism: Business-cycle changes in consumption. 2026 example: Demand destruction from $100+ oil
- —Speculative/inventory demand shock. Mechanism: Forward-looking stockbuilding. 2026 example: Record stock draws, then hoarding by importers
Two propositions from that framework guide the analysis. First, OPEC's leverage depends on spare capacity it can actually deliver; capacity trapped behind a closed strait confers no power. Second, OPEC is squeezed whenever non-OPEC supply rises or demand falls, as it was in the 1980s, when its market share fell from 53% in 1973 to 28% in 1985 [1].
We add a fifth force that the 1973–2018 literature treated as secondary: sanctions and trade policy as supply instruments. In 2026, US Treasury licences, EU price caps and tariff penalties redirected more barrels than any OPEC+ decision.
Figures are drawn from the IEA, EIA, OPEC, CREA, KSE Institute, Kpler and wire reporting, cited by number and listed under References. Ship-tracking estimates differ by method, so volumes are given as ranges where sources diverge.
Historical evolution of oil-price shocks, 1973–2018
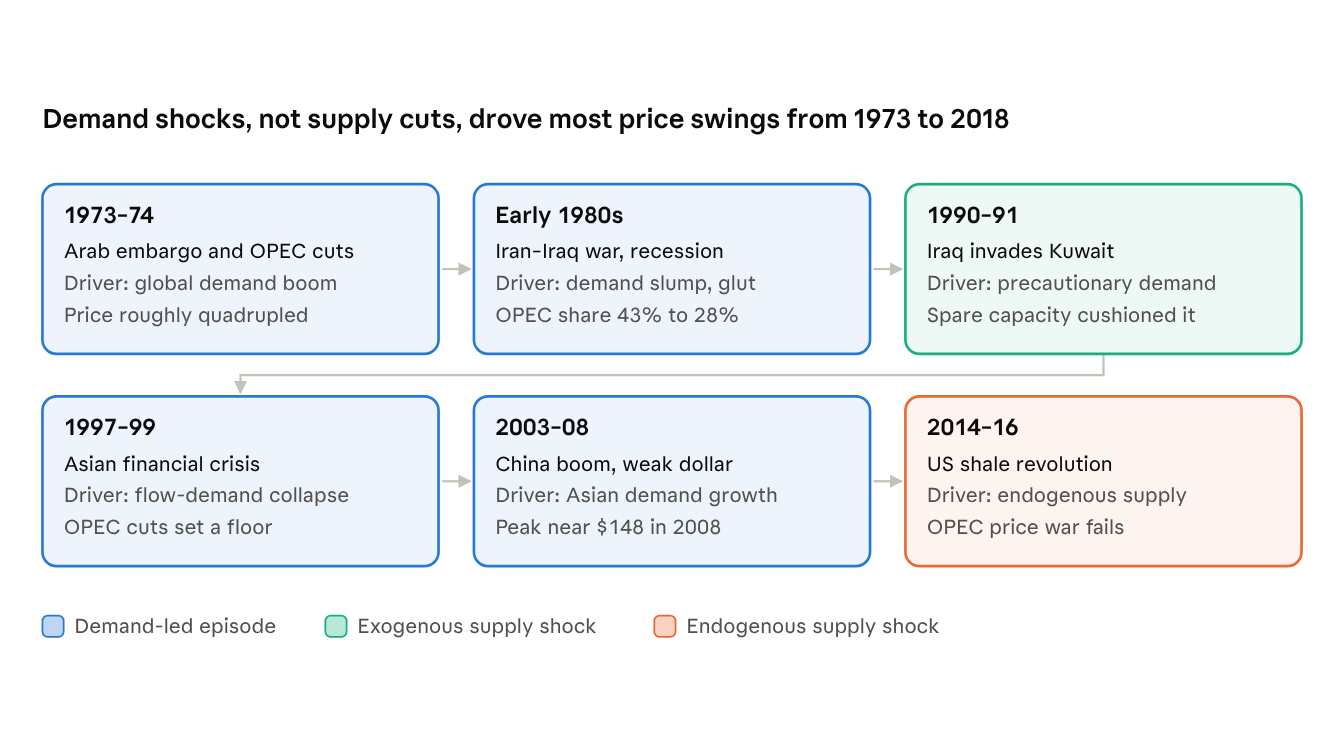
The largest price swings came when stagnant demand met strong supply growth, or when rising demand met a limited supply response. Without spare capacity, the low price elasticity of oil means substitutes and demand adjustments cannot cap a short-term spike, so prices jump sharply [2].
This section maps the price record against exogenous and endogenous shocks across five periods: 1973–74, the 1980s glut, the Gulf War, the 1997 Asian crisis and the 2008 financial crisis, ending with the shale shock of 2014. OPEC's pricing power is read throughout as its ability to smooth shocks and stabilise price, a power that "should not be overblown" and is moderated by market conditions despite its low-cost reserves [4].
One facet remains under-studied in the literature: OPEC's investment decisions. To keep its influence, it must expand capacity without eroding the spare capacity that gives it leverage, planning "both the timing and the size of new capacity" so that prices do not fall sharply [71]. Because most members are undiversified rentier economies, poor capacity planning costs them more than it costs non-OPEC producers.
1973 crisis to the 1980s oil glut
The price quadrupling of 1973 is traditionally blamed on OPEC's decision to cut output by 5%, and then by a further 25%, in October and November 1973 [1]. The evidence points elsewhere. Non-oil industrial commodity prices rose by more than 75% over the same period, suggesting that at most 25% of the oil price increase came from exogenous supply shocks [1]. The main drivers were an unexpected global business-cycle upswing and precautionary demand for inventories in anticipation of shortages [1].
The production downturn also reflected OPEC's repudiation of the 1971 Tripoli and Tehran agreements, which had bound members to supply large volumes at low posted prices. Strong global demand in 1972, the devaluation of the US dollar and unexpected US inflation made the price increase endogenous to macroeconomic conditions [70]. OPEC did exert market power by unilaterally setting the posted price, but it would be wrong to treat 1973 as proof of a monolithic cartel with full price-setting power.
The early 1980s were different: an exogenous supply shock, the Iran–Iraq war, arrived without strong demand growth. A global slowdown left OPEC with surplus capacity estimated at 14 million b/d, removing any incentive to expand [74]. OPEC tried to restrain output but members cheated, and it was squeezed from both sides: non-OPEC output kept rising even as prices fell, while the "call on OPEC" shrank (Figure 1).
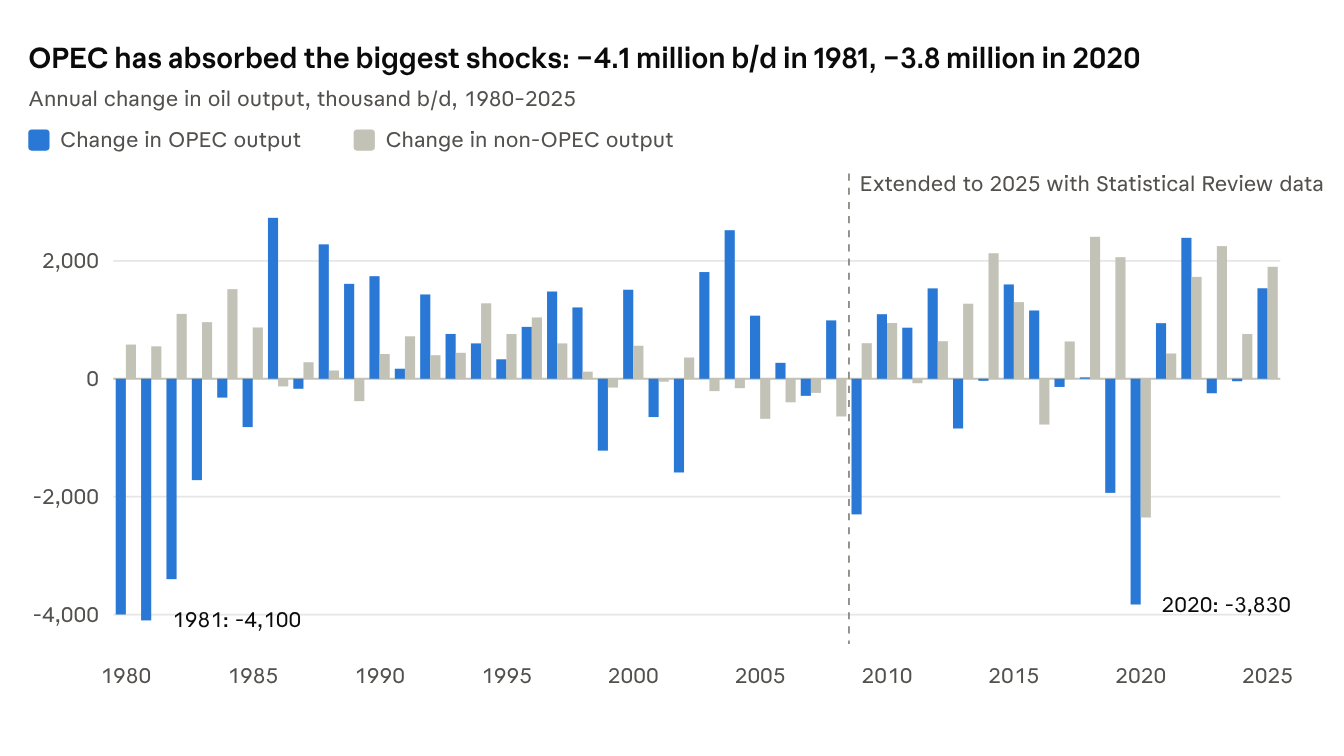
Saudi Arabia acted as swing producer from 1983 to 1985 to stabilise price and defend market share. When its profits fell below Cournot levels, it switched to a tit-for-tat strategy to punish cheating and restore discipline [72].
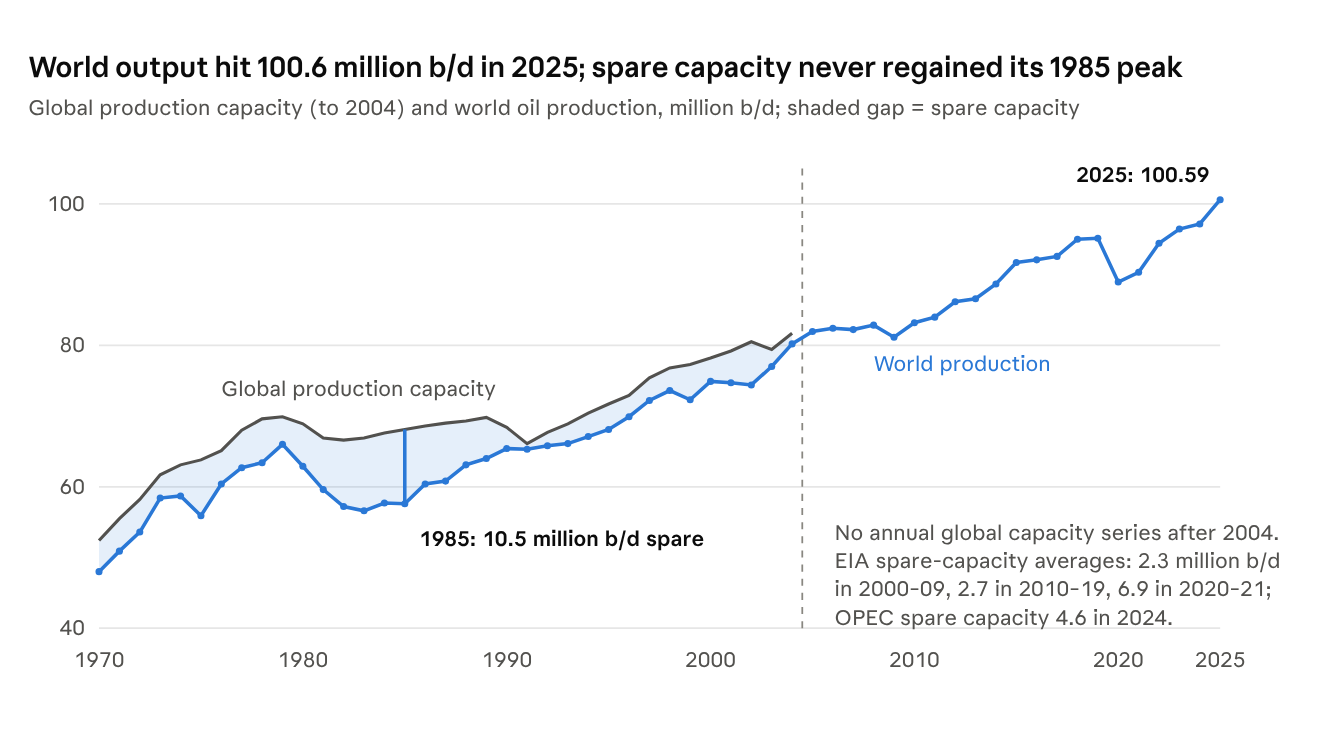
Because supply responds slowly, the supply response to the 1970s price rises became important only in the early 1980s [1]. Over-investment in the 1970s, a global recession that cut flow demand, and high interest rates that triggered inventory sell-offs together drove the decline. OPEC's market share fell from 53% in 1973 to 43% in 1980 and 28% in 1985 [1], and spare capacity peaked at around 10 million b/d in 1985 (Figure 2). The lesson: with falling demand and large spare capacity, OPEC's market power is severely constrained.
1990s: the erosion of spare capacity
The 1990s saw OPEC's spare capacity erode gradually, weakening the system's ability to absorb shocks. Demand for oil is price-inelastic but highly income-elastic [73], and supply is inelastic in the short run, so thinner spare capacity magnifies the price impact of any shock. From the early 1990s, growth in global demand outpaced growth in non-OPEC supply in almost every year [74].
Iraq's 1990 invasion of Kuwait raised precautionary demand on fears that Saudi supply could be hit. Prices did not ratchet upward, because a spare-capacity cushion still existed; the same shock in the tight market of 2004 would likely have caused a far larger price swing.
The 1997 Asian financial crisis slowed Asian growth and pushed prices down. OPEC responded with two production cuts in 1998 and 1999 to set a price floor, but structural modelling shows that flow-demand shocks account for most of the 1997–99 price collapse [2].
2000s: the China factor and the 2008 crash
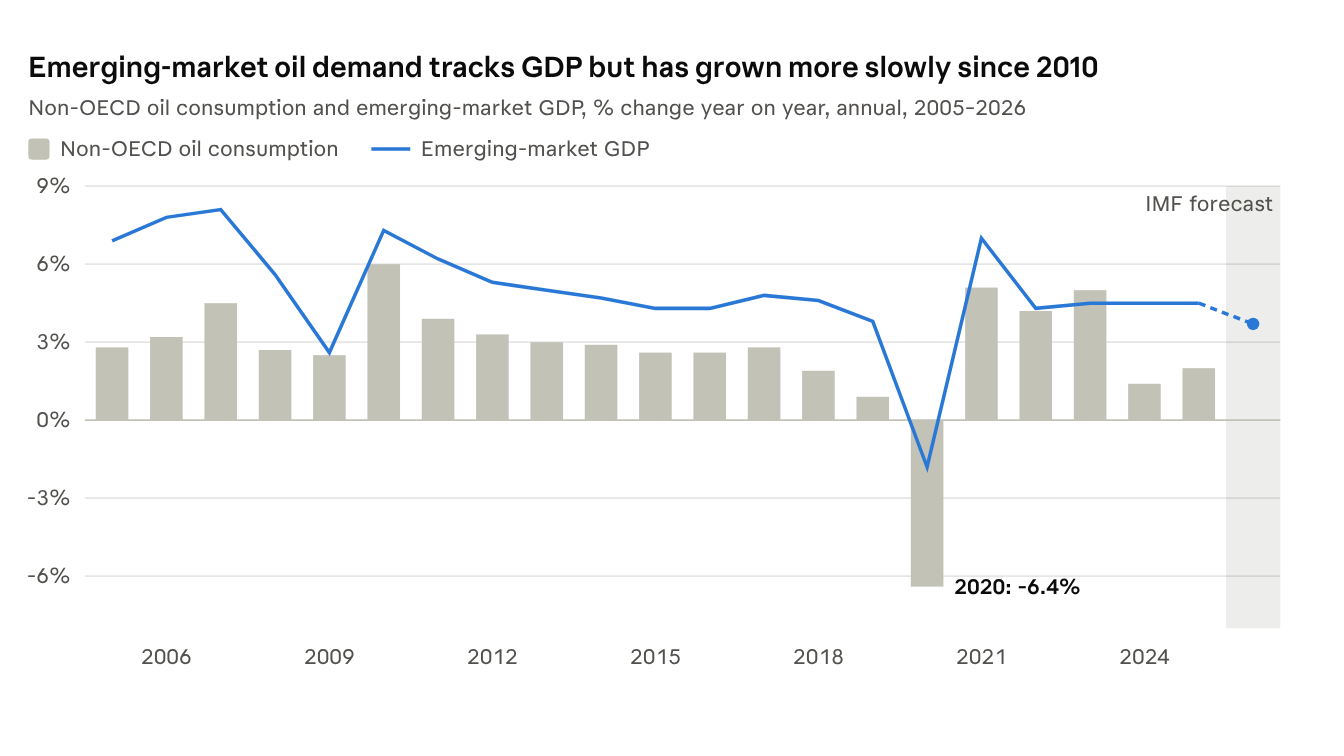
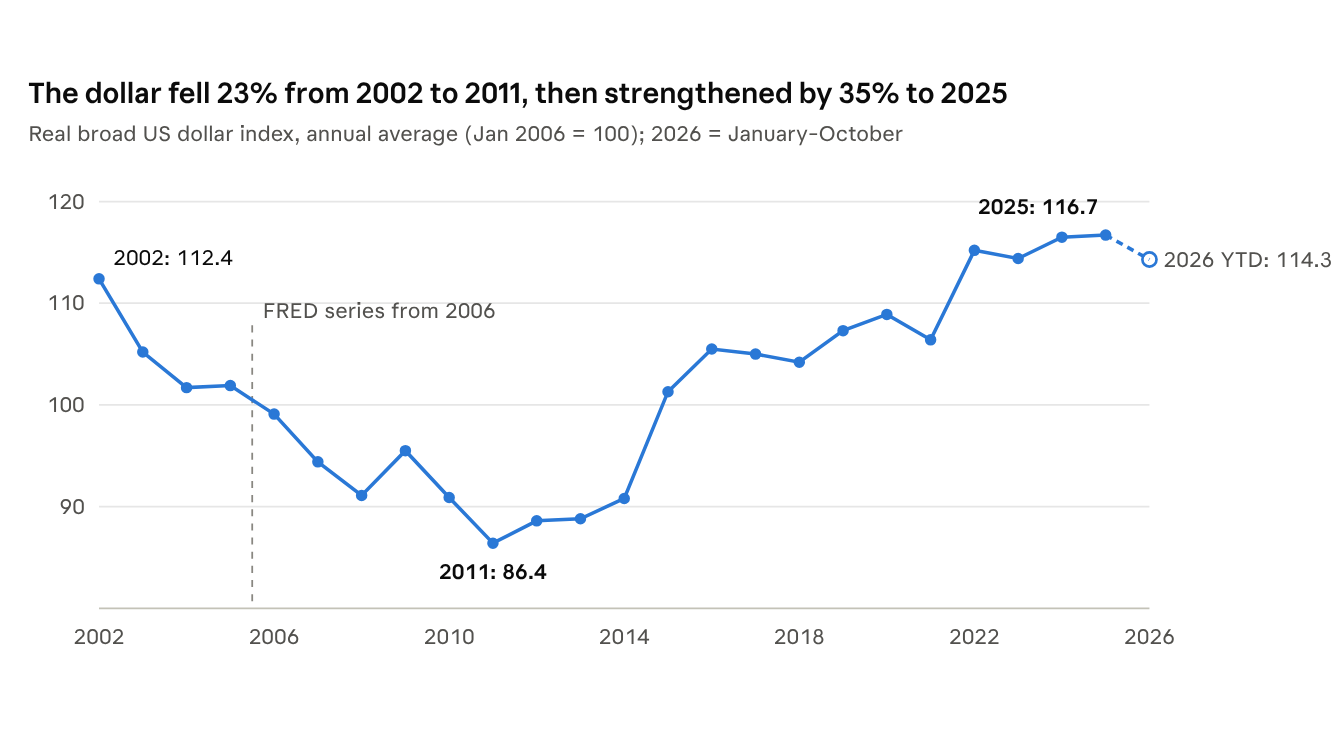
The 2000s brought a steep and sustained rise in oil prices, driven by strong growth in China and other Asian economies [1] (Figure 3) and by a weaker dollar, which lowered the price of oil in other currencies (Figure 4). OPEC under-investment in capacity during the 1990s [75], combined with rising demand for OPEC oil, eroded spare capacity further.
Exogenous shocks added uncertainty: the strike at Venezuela's PDVSA and the 2003 Iraq war. Arriving in a market of excess demand and shrinking spare capacity, especially in Saudi Arabia, they built a high risk premium into prices.
The 2008 financial crisis ended the upswing. Prices fell from a peak of $148.36 to $49.85 by January 2009 [76]. OPEC held together in the face of falling demand, announcing a 4.2 million b/d cut and a $70–80 target [77], and prices were back above $80 in 2010.
2014: the shale shock and OPEC's breakeven problem
The US shale revolution of 2014 was an endogenous supply shock, the product of heavy capital investment in fracking from the mid-2000s [78]. From January 2011 to mid-2014, shale output trebled and the US share of world production rose from 7% to 12%.
OPEC responded by raising output to regain market share, aiming to squeeze shale producers whose marginal costs were much higher [79]. Shale survived through mergers and technical gains such as re-fracking, which cut marginal costs and made its supply more price-elastic than conventional upstream [26]. OPEC could not hold prices low for long, because its members depend heavily on oil revenue, and it turned to production cuts with Russia, the origin of OPEC+.
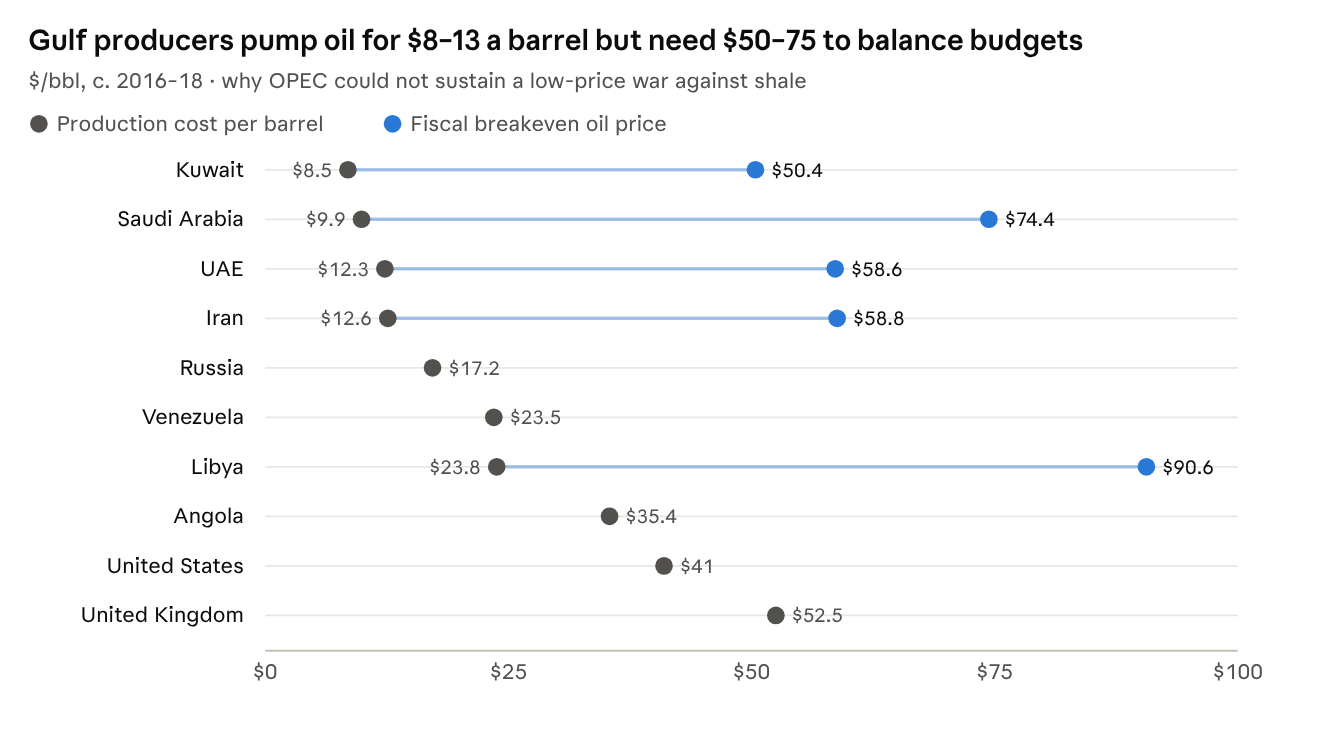
The gap between the two measures explains the outcome. OPEC's Gulf members have the world's cheapest barrels, but their budgets need prices four to eight times higher than their production costs. In a price war, the competitive fringe loses money on each barrel, while OPEC governments lose fiscal solvency.
The 2018 outlook, and what followed
In 2018 the balance of risks looked clear. With global GDP projected to grow 3.9% in 2018 and 2019 [82], short-run demand inelasticity would sustain consumption. OPEC forecast global demand rising from 96.8 million b/d in 2017 to 102.2 million b/d in 2022, led by China (12.2 to 13.6 million b/d), with OECD demand peaking near 47 million b/d around 2021 [83].
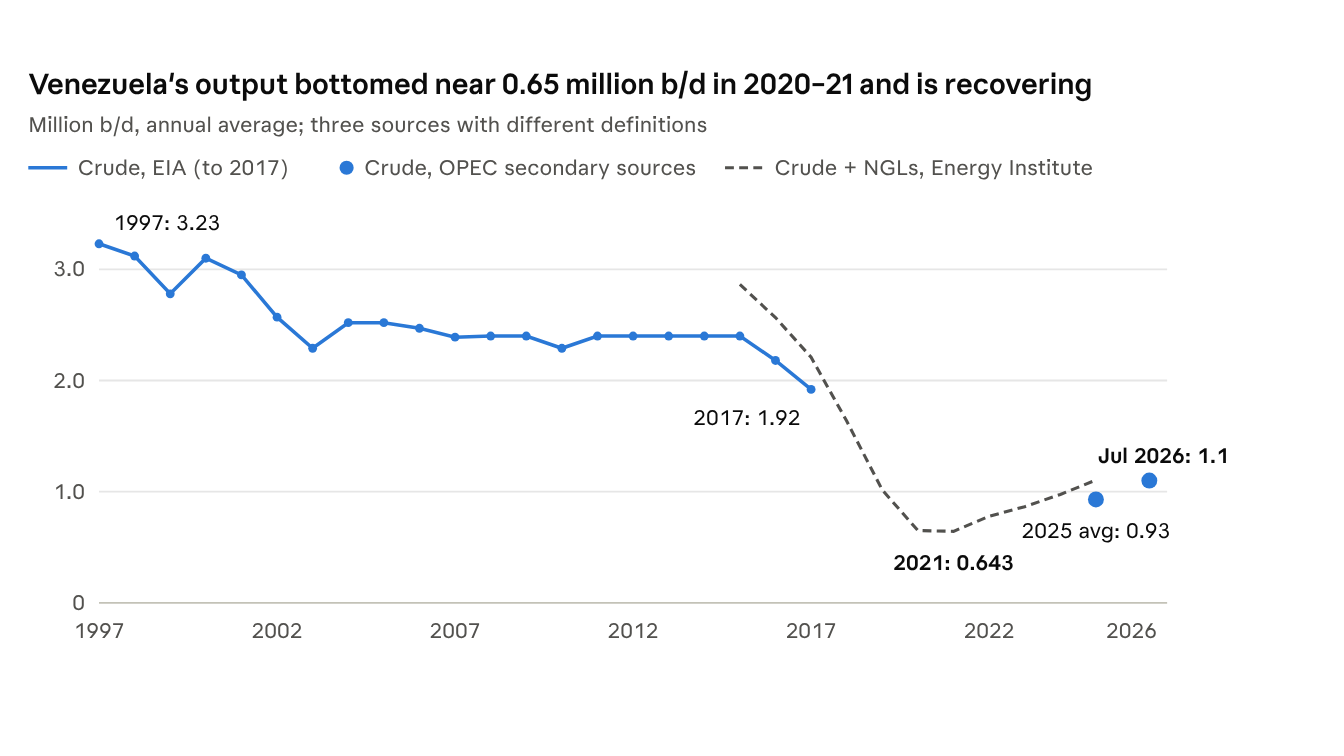
On the supply side, US sanctions on Iran threatened about 5.3% of global production [84], though Saudi spare capacity and waivers for Asian buyers could soften the blow. Tension in the Strait of Hormuz was flagged as a source of short-term price spikes because the capacity cushion was thin. Venezuelan output had fallen from 2.3 million b/d in 2016 to 1.6 million b/d in 2018 and was expected to keep falling [85] (Figure 5).
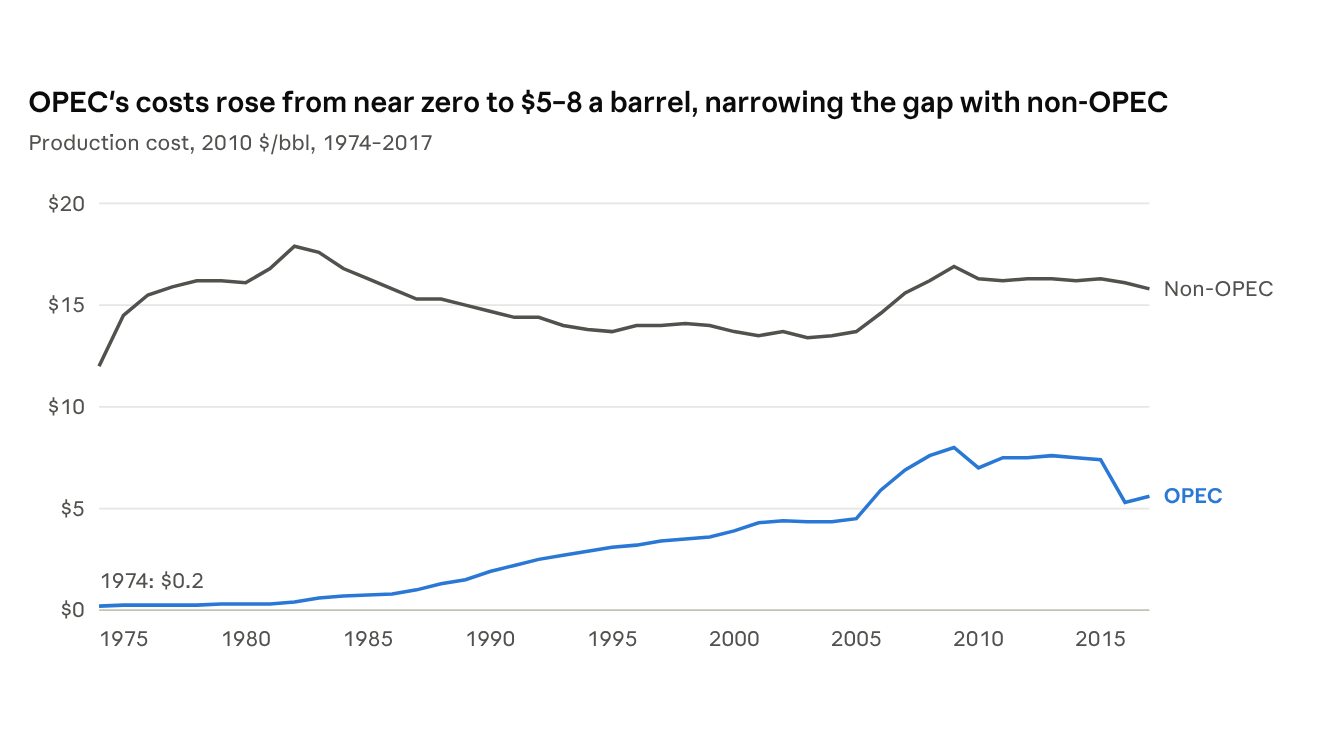
In the long run, the market was judged to be moving from scarcity to abundance: new discoveries, shale and maturing substitutes would push prices toward the cost of the marginal barrel [79], and the cost gap between OPEC and non-OPEC producers would narrow over time [86] (Figure 6). The focus would shift from peak supply to peak demand [87].
What followed. Several of these calls proved prescient by 2026. The Hormuz risk materialised on a scale no one modelled: the 2026 war closed the strait and became the largest supply disruption on record [10]. Venezuela's decline continued until the US capture of Maduro reopened exports, which jumped to about 800,000 b/d in January 2026 [91]. And the peak-demand debate moved from theory to data, as high prices pushed the IEA to forecast a fall in world oil demand in 2026 [11].
OPEC: from price-setter to residual stabiliser
OPEC's control of the oil price has eroded in three waves, and 2026 delivered the third. The first came in the 1980s, when non-OPEC growth and collapsing demand forced Saudi Arabia into the role of swing producer. The second came with US shale after 2011, which OPEC tried and failed to price out of the market in 2014–16, ending with the OPEC+ alliance with Russia.
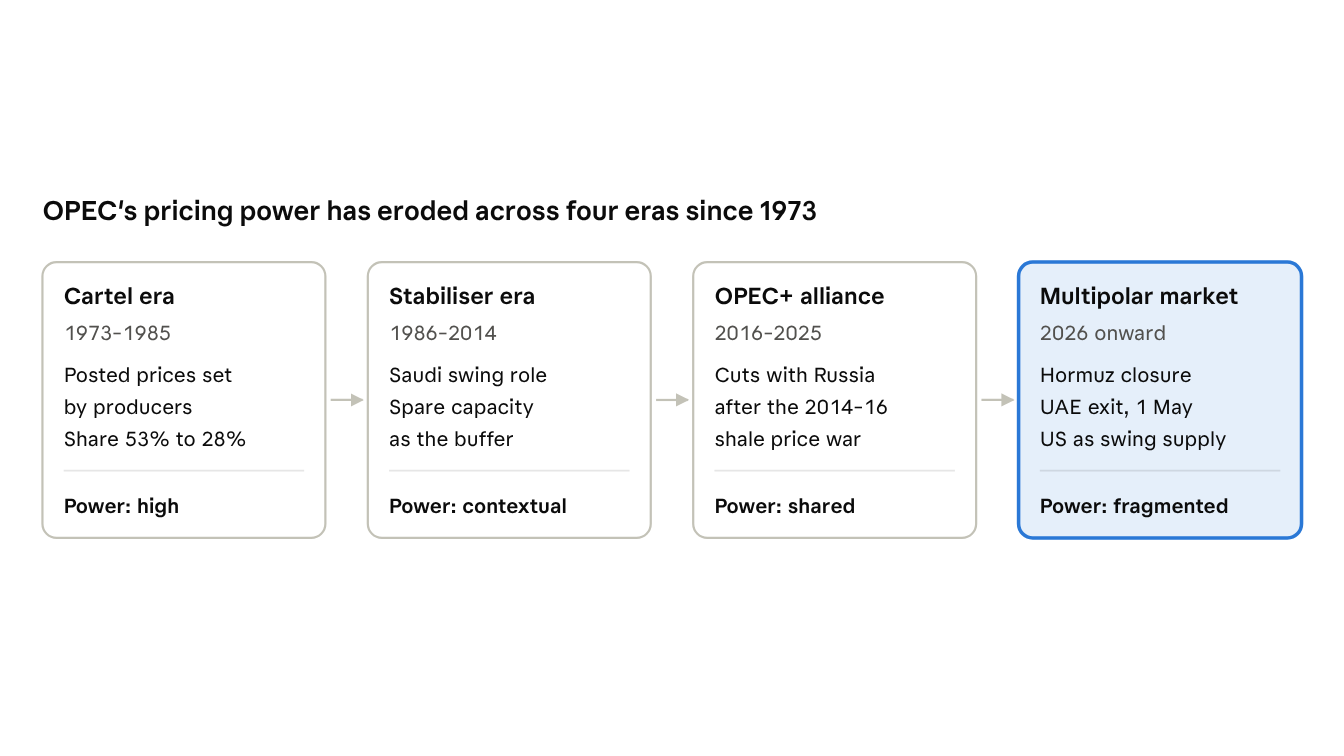
Each era ended when non-OPEC supply or a shock removed the conditions for OPEC's leverage: low-cost spare capacity it could deliver, and members willing to hold barrels back.
The 2025–26 unwinding
OPEC+ entered 2026 trying to win back market share rather than defend price. In November 2025 it paused increases for the first quarter of 2026 and approved a capacity-based quota system for 2027, backed by third-party audits of members' capacity from January to September 2026 [5]. Brent then traded near $64 a barrel [6].
From April to September 2026, the core group raised targets monthly to unwind the 1.65 million b/d of voluntary cuts announced in April 2023, then paused from October [7]. Most of those increases never reached the market. The seven core members pumped 25 million b/d in August, roughly 5 million b/d below February's pre-war level [8]; their December quota stands at 31.01 million b/d [9].
The Hormuz shock and the UAE exit
The IEA called the Iran war "the largest supply disruption in the history of the global oil market" [10]. Before the war about 20 million b/d passed through Hormuz; by April, Gulf output affected by the closure was 14.4 million b/d below pre-war levels [11]. OPEC's spare capacity, the basis of its power in the framework above, was stranded behind the strait.
On 28 April 2026 the UAE announced it would leave OPEC and OPEC+ from 1 May, after years of disputes over quota baselines [12]. It had been producing around 3.4 million b/d [13], about 11% of the OPEC+ Declaration of Cooperation output [14]. Saudi Arabia now carries more of the burden of stabilisation with less spare capacity inside the group.
Assessment
OPEC remains important as a coordinating forum and as the owner of the cheapest reserves. But it no longer meets the two conditions for price-setting identified by Fattouh [3]: deliverable spare capacity and member discipline. The capacity audit due to set 2027 quotas is the next test; a fractious outcome would invite further exits from producers with growing capacity.
The rise of Russian oil: a parallel market
Sanctions since 2022 have rerouted Russian oil rather than removed it, building a second oil market with its own ships, insurers and buyers. Russia exported about 6 million b/d of crude and products by sea in June 2026, on 325 tankers, of which 176 belonged to the shadow fleet [15].
The sanctions toolkit and its limits
- —EU/G7 crude price cap. Date: Lowered to $44.10/bbl from 1 Feb 2026 (was $60, then $47.60). Design: Western shipping and insurance only for oil sold below cap. Observed effect: Only about 35% of vessels complied at the $47.60 cap [16]
- —US sanctions on Rosneft and Lukoil. Date: 22 Oct 2025. Design: Blocks transactions with Russia's two largest producers. Observed effect: Indian buying dipped, then recovered [17]
- —EU ban on products refined from Russian crude. Date: 21 Jan 2026. Design: Products loaded within 60 days of Russian crude receipt are barred [18]. Observed effect: Reshaped Indian and Turkish export refining
- —Tanker listings and seizures. Date: Ongoing; US seizures from Jan 2026 [19]. Design: Removes vessels from service. Observed effect: 431 of 596 EU-listed tankers loaded Russian oil again after listing [15]
The shadow fleet has adapted rather than shrunk. In October 2026, 60% of Russia's seaborne oil moved on sanctioned shadow tankers, and the Russian flag had become the fleet's largest, carrying 47% of its cargo against 6% a year earlier [20].
Price, revenue and the war premium
Sanctions worked best when oil was cheap. In January 2026 Urals traded near $40/bbl FOB, below the cap [21]. The Hormuz closure reversed that: Urals averaged $60.22 in July, well above the $44.10 cap [22], and KSE's base case now has Russian oil export revenue rising from $158 billion in 2025 to $183 billion in 2026 [23].
The war has also hit Russia's own refining. Ukrainian drone strikes pushed product loadings to a record low of 4.7 million tonnes in July 2026, less than half the July 2025 level [22]. Russia has therefore become more of a crude exporter and more dependent on Asian refiners, India above all.
Assessment
Russian oil is now a permanent second channel of supply whose price depends on how tight the first channel is. When Gulf supply is plentiful, sanctions compress Russian prices and widen discounts to Asian buyers. When it is scarce, as in 2026, Western governments relax enforcement to cap prices, and Russian revenues recover. Peace talks between Russia, Ukraine and the US, scheduled for 10–11 November [24], are the main variable for 2027.
US shale: the new swing producer
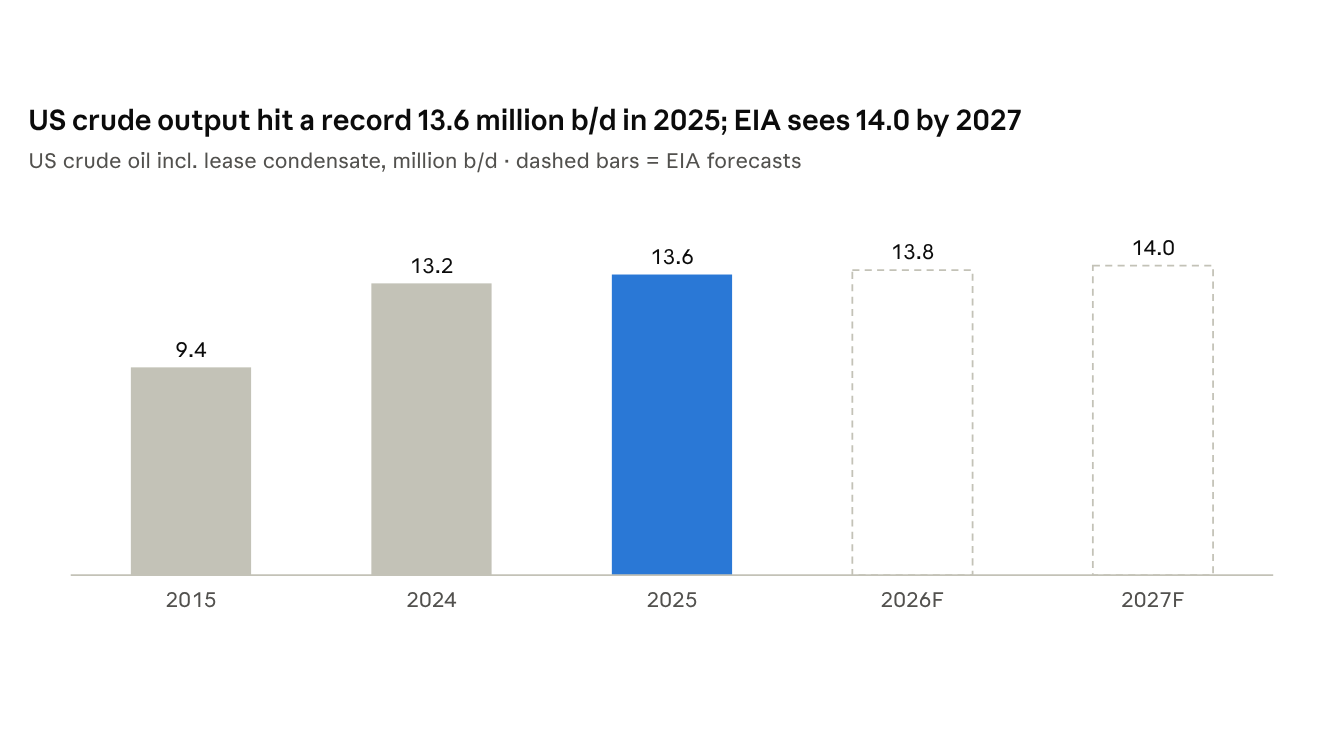
The United States has been the world's largest crude producer every year since 2018, and in 2026 its short-cycle shale supply did the stabilising work once reserved for Saudi spare capacity. US crude output averaged a record 13.6 million b/d in 2025, beating the previous global record of 13.2 million b/d set in 2024 and running about 40% above Russia or Saudi Arabia [25].
From endogenous shock to price ceiling
The historical analysis above framed shale as an endogenous supply shock: investment in fracking in the mid-2000s lifted the US share of world output from 7% in 2011 to 12% by mid-2014 and triggered OPEC's failed price war. Re-fracking, consolidation and efficiency gains lowered marginal costs and made shale supply more price-elastic than conventional upstream [26]. The repeal of the US crude export ban in December 2015 then turned that domestic surplus into a global swing supply.
The 2026 data show that elasticity at work. With WTI averaging $84/bbl through August against $65 in 2025, the EIA expects Permian output to rise 3% to 6.8 million b/d and total US output to reach a record 13.8 million b/d [27]. Production averaged 13.7 million b/d in the first half, and federal offshore output rose 10% as new deepwater projects came online [28]. The US now supplies roughly 18% of world crude [29].
Limits of the shale model
Shale is maturing. Growth now relies more on high prices and offshore projects than on new basins, and the EIA's 2027 forecast of about 14.0 million b/d implies slowing gains [30]. Shale can cap a price spike within months, but it cannot replace 13 million b/d of lost Gulf flows; that took stock draws, demand destruction and rerouting.
Energy as statecraft
Washington has used its producer status as leverage. The February 2026 US–India deal tied tariff relief to Indian purchases of US energy, and Treasury licences decided which buyers could take Russian or Venezuelan barrels. Indian imports of US crude averaged about 310,000 b/d in 2025, up from 199,000 b/d in 2024 [31].
Assessment: the US is the marginal supplier and, through sanctions, the market's regulator. That combination gives it more practical influence over prices in 2026 than OPEC.
The geopolitics of 2025–26: sanctions, wars and waivers
In 2026, war and sanctions, not quotas, set the oil price. Brent moved from about $72 before the Iran war to above $116 in March, fell below $80 after the June memorandum, rose again when talks stalled, and has slid back toward $93–96 in November on peace hopes and returning supply.
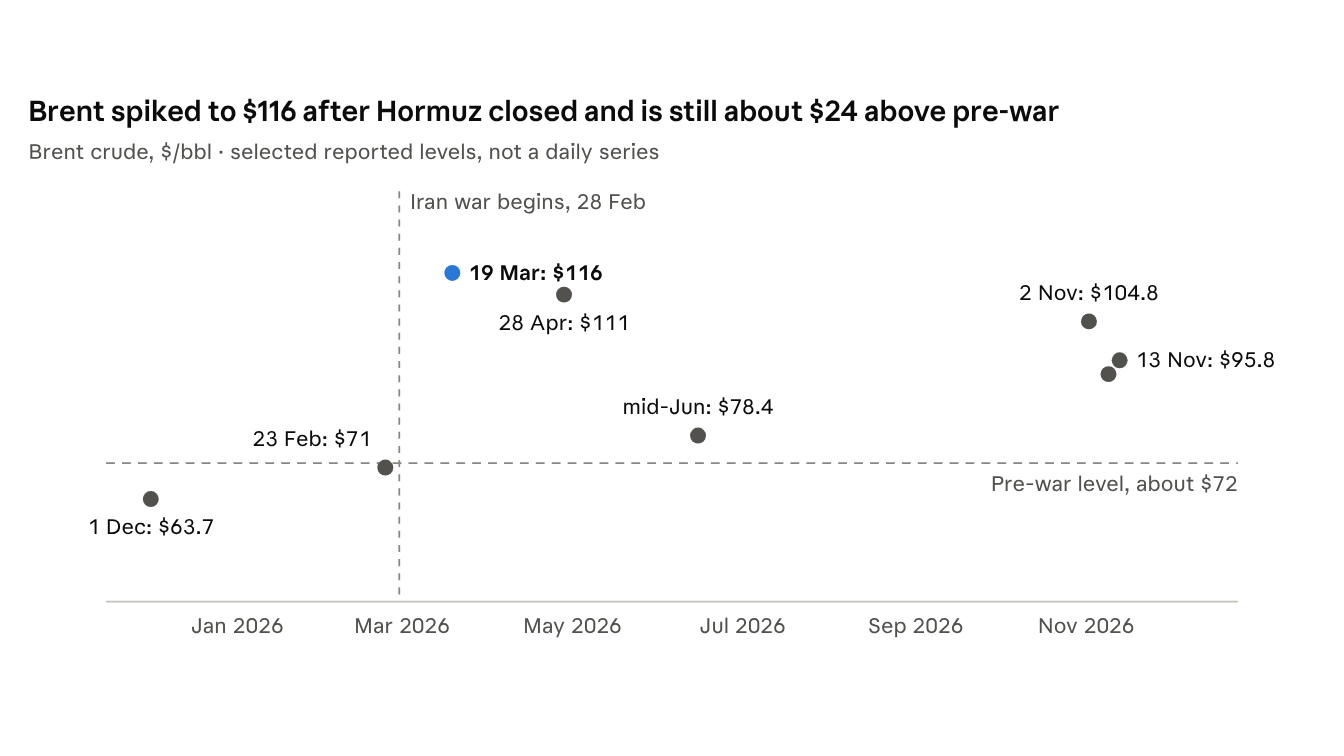
The price path tracks physical flows through the strait more closely than any OPEC+ decision. Flows fell to almost nothing in March, recovered partly after the June memorandum, and slipped again as talks stalled.
Timeline of decisive events (newest first)
- —14 Nov 2026. Event: IEA says supply exceeded demand by nearly 2 million b/d in October, the first surplus since the war began [32]. Market significance: Narrative shifts from shortage to glut
- —9 Nov 2026. Event: Brent settles at $92.57 after a 16% weekly fall; Iraq secures a Hormuz shipping lane near Oman [33]. Market significance: Gulf exports recovering
- —2 Nov 2026. Event: Qatari-mediated US–Iran talks; Brent falls 7% to $104.77 [34]. Market significance: Peace premium enters prices
- —Sep 2026. Event: Gulf crude exports exceed 75% of pre-war levels via ship-to-ship transfers and bypass routes [35]. Market significance: Partial recovery; products still tight
- —Jun 2026. Event: US–Iran memorandum of understanding; Brent near $78 [36]; US waiver on Russian oil for India lapses 17 June [37]. Market significance: Temporary de-escalation
- —1 May 2026. Event: UAE leaves OPEC and OPEC+ [12]. Market significance: Cartel cohesion broken
- —5 Mar 2026. Event: US Treasury licence lets India buy Russian oil already at sea, later extended several times [38], [37]. Market significance: Sanctions relaxed to cap prices
- —28 Feb 2026. Event: US-Israeli strikes on Iran; Hormuz traffic halts [39]. Market significance: Largest supply disruption on record
- —2–6 Feb 2026. Event: US–India interim trade deal: tariff cut to 18%, 25% Russian-oil penalty removed [40]. Market significance: India pledges to curb Russian crude
- —1 Feb 2026. Event: EU/G7 crude price cap cut to $44.10 [19]. Market significance: Tighter Russia squeeze
- —21 Jan 2026. Event: EU ban on products made from Russian crude takes effect [41]. Market significance: Third-country refiners must segregate
- —3 Jan 2026. Event: US operation captures Nicolás Maduro; Venezuelan exports reopen [42]. Market significance: Heavy crude returns to market
- —22 Oct 2025. Event: US sanctions Rosneft and Lukoil [17]. Market significance: Pressure on Russian supply chains
Three structural lessons
- —1. Chokepoints beat cartels. Physical control of Hormuz mattered more than any OPEC decision. Producers with routes that bypass the strait, such as Russia, the Americas and West Africa, gained market share.
- —2. Sanctions are now counter-cyclical. Washington tightened on Russia and Venezuela when oil was cheap and loosened when it was dear. Importers that can switch quickly capture the arbitrage.
- —3. Energy and trade policy have merged. Tariffs, licences and purchase commitments now sit in the same agreements, as the US–India deal shows.
These lessons support the central claim drawn from the 1973–2018 record, with a twist: geopolitical events still matter mainly through their effect on spare capacity and expectations, but in 2026 the shock was large enough to overwhelm every buffer at once.
India's strategic position: the swing refiner
India has turned import dependence into leverage by buying from every pole of the new market and refining what others cannot. It imports nearly 88% of its crude [43], and its crude imports hit a record 5.54 million b/d in October 2026 [44].
Russian crude: from discount play to security hedge
Russia went from under 2% of India's crude imports in 2019–20 to India's largest supplier after 2022, as sanctions made its barrels cheap. In February 2026 India agreed under the interim US trade deal to stop buying Russian oil; the US cut its tariff to 18% and removed the 25% penalty, while warning it could reimpose duties if India resumed imports directly or indirectly [45].
The Hormuz closure reversed that pledge within a month. Russian cargoes bypass the strait [46], and Washington itself licensed Indian purchases from 5 March. Imports reached a record 2.8 million b/d in July 2026, about 55% of the total [47]. The economics changed too: the Urals discount to Brent narrowed from over $10 in early July to $1–2 by month-end [48].
Russia's share fell to about 35% in September as Gulf supply returned and Venezuelan crude arrived [49]. Volumes rose about 10% in October [43], and India bought a record €6.4 billion of Russian fossil fuels that month, second only to China [50]. Meanwhile, the value of India's US crude purchases rose nearly 64% in April 2025–January 2026 as refiners hedged against US tariffs [61].
Jamnagar and the question of "reselling"
India does not resell Russian crude; it refines it and exports fuels, a distinction that matters both legally and diplomatically. Reliance's Jamnagar complex has about 1.4 million b/d of capacity in two refineries [51], a complexity index of 21.1, and a record of processing more than 216 crude grades [52].
The EU ban on products made from Russian crude, in force from 21 January 2026, forced a split. Reliance stopped running Russian crude in its export-only SEZ refinery from 20 November 2025, keeping it for the domestic refinery [53]. This segregation keeps premium European and US product markets open while preserving access to cheaper feedstock.
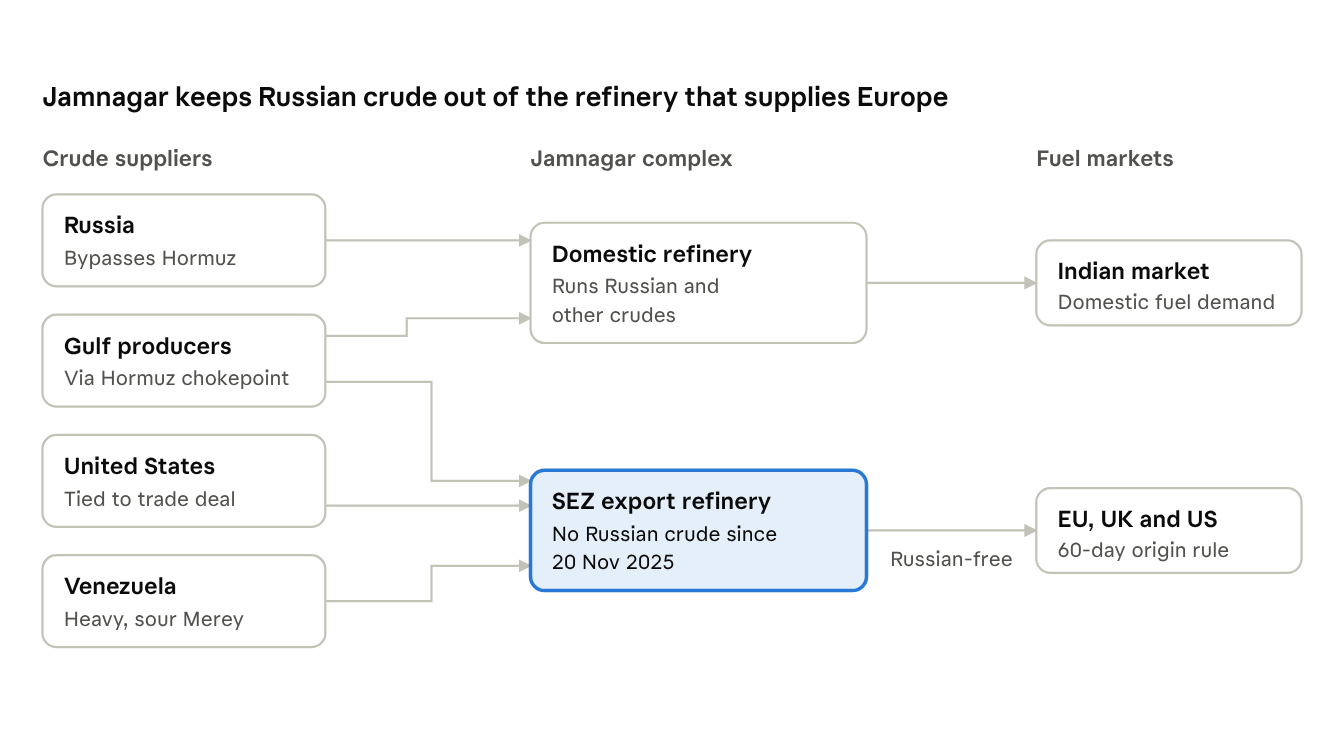
Russian crude feeds only the domestic refinery; the export refinery runs Gulf, US and Venezuelan grades so that its fuels meet the EU rule barring products loaded within 60 days of receiving Russian crude.
Critics argue the line leaks. CREA reports that Jamnagar supplied six of seven Russian-crude-linked cargoes unloaded at EU ports in September 2026 [54], and that 30% of Jamnagar's crude imports from August to October were Russian [55]. Reliance has given buyers written declarations that EU-bound fuels contain no Russian crude [41]. Verification, not volume, is now the main reputational risk.
Venezuela: Jamnagar's natural feedstock returns
Jamnagar's cokers were built for heavy, sour crude such as Venezuela's Merey. After the US capture of Maduro on 3 January 2026, Reliance received a US general licence in February to buy Venezuelan crude directly [56] and bought its first 2 million barrels from Vitol for April delivery [57].
Flows have grown fast. Venezuelan arrivals hit a record 427,000 b/d in May, overtaking Saudi Arabia and the US to become India's third-largest supplier that month, and Kpler projects about 465,000 b/d in October, the highest since December 2019 [49]. Reliance took 76% of September's shipments, and Merey has been offered about $16/bbl below Dated Brent. US Secretary of State Rubio toured Jamnagar in October to discuss Reliance's role in Venezuelan production [58].
India's position in one table
- —Russia. 2026 role: Largest supplier; Hormuz-proof; discount now thin. Main risk: US secondary tariffs; EU product rules
- —Gulf (Iraq, Saudi Arabia, UAE). 2026 role: Traditional base load; recovering after Hormuz. Main risk: Chokepoint closure, mines, insurance
- —United States. 2026 role: Political hedge tied to trade deal. Main risk: Higher landed cost and freight
- —Venezuela. 2026 role: Discounted heavy crude suited to Jamnagar. Main risk: Licence revocation, Venezuelan politics
India's leverage comes from flexibility. It can absorb whichever barrel Washington, Moscow or the Gulf needs to place, and that makes it useful to all three.
Outlook and scenarios to 2030
The base case is a swing from scarcity to surplus in 2027, which will test OPEC+ cohesion again and widen discounts for flexible refiners like India. The IEA expects global supply to fall 5.7 million b/d to 100.7 million b/d in 2026, then rebound by 8 million b/d in 2027 [62]. The upside risk is real: Goldman Sachs says Brent could reach $140 in 2027 if Gulf output stays 3.5 million b/d below its 2025 average [63].
- —A. Durable peace and glut (base case). Triggers: US–Iran settlement holds; Hormuz cleared of mines; Russia–Ukraine ceasefire. Oil price direction: Falling; surplus through 2027. OPEC+: Market-share competition; 2027 capacity quotas contested. Implication for India: Wider discounts on Russian and Venezuelan crude; refining margins rise; US pressure to cut Russian oil returns
- —B. Armed truce. Triggers: Intermittent strikes; partial Hormuz flows; sanctions unchanged. Oil price direction: Volatile, elevated risk premium. OPEC+: Saudi Arabia manages cuts with less spare capacity. Implication for India: Russia stays a hedge; waivers renegotiated case by case
- —C. Renewed closure. Triggers: Talks collapse; Gulf output stays well below 2025. Oil price direction: Sharp spike. OPEC+: Quotas irrelevant. Implication for India: Maximum reliance on Russia and the Americas; strategic reserves tested
Structural trends that hold in every scenario
- —1. A multipolar supply system. No single producer group can set prices; the US, Russia, Saudi Arabia and a free-agent UAE each pursue volume.
- —2. Routes over reserves. Supply that avoids chokepoints will earn a security premium in buyers' portfolios.
- —3. Sanctions as a permanent market feature. Price caps, product-origin rules and licences will keep splitting the market into compliant and shadow tiers.
- —4. Demand plateau in the OECD, growth in Asia. The 2018 outlook expected the debate to shift from peak supply to peak demand. High 2026 prices accelerated demand destruction, but India's demand growth keeps it the marginal buyer the market courts.
- —5. Complex refining as strategic capacity. Refineries that can switch among 200-plus grades turn geopolitical disruption into margin.
Policy recommendations for India
India's priority should be to make its flexibility deliberate and durable rather than improvised in each crisis. When Hormuz closed, India reportedly held crude and gas stocks for only about 25 days [64].
- —1. Expand strategic and commercial storage. Raise reserve cover well beyond 25 days, using low-price windows in a 2027 glut to fill caverns and commercial tanks.
- —2. Formalise a three-pillar supply portfolio. Keep term contracts across the Gulf, Russia and the Americas so no single route or sanction regime exceeds a set share of imports outside emergencies.
- —3. Negotiate rules, not waivers. Seek a standing understanding with Washington on Russian crude, for example volume or price thresholds, instead of 30-day licences that leave refiners exposed.
- —4. Build verifiable crude traceability. Extend Jamnagar-style segregation to other export refineries, with third-party audit trails, so EU and UK origin rules cannot shut Indian products out.
- —5. Secure Venezuelan and Latin American upstream access. Pair Reliance's purchase rights with state-backed equity and service contracts while US licences are available, and share heavy-crude capacity across Nayara's Vadinar and IOC's Paradip [65].
- —6. Develop payment and shipping resilience. Broaden rupee settlement, Indian-flagged tonnage and domestic marine insurance to reduce dependence on any one financial or insurance system.
- —7. Use refining as diplomacy. Position India as the refining partner for the US in Venezuela, for Gulf producers seeking non-Hormuz outlets, and for Africa's light-crude producers.
- —8. Keep the transition in view. Oil security buys time; electrification of transport and biofuels reduce the import bill that makes India vulnerable in the first place.
Conclusion
The "cartel century" that began in 1973 has ended, not because OPEC dissolved but because the conditions for its power, deliverable spare capacity and member discipline, failed at the same time. In its place stands a multipolar market where US shale caps prices, Russian oil moves through parallel channels, and sanctions and chokepoints decide which barrels reach which buyers.
The record from 1973 to 2018 shows that OPEC's influence was always contextual. The events of 2026 confirm that and add a corollary: in a fragmented market, influence passes to whoever controls flexibility. For producers that means short-cycle supply; for consumers it means refineries, storage and diplomatic room to switch suppliers. India, with Jamnagar at its centre, holds more of that flexibility than any other importer, provided it institutionalises it before the next shock.
References
Numbers in square brackets in the text refer to this list. Ship-tracking volumes are preliminary and often revised. Web sources accessed November 2026.
- —1. Baumeister, C. and Kilian, L. (2016). Forty Years of Oil Price Fluctuations: Why the Price of Oil May Still Surprise Us. Journal of Economic Perspectives, 30(1), 139–160.
- —2. Economou, A., Agnolucci, P., Fattouh, B. and De Lipsis, V. (2017). A Structural Model of the World Oil Market: The Role of Investment Dynamics and Capacity Constraints in Explaining the Evolution of the Real Price of Oil. Oxford Institute for Energy Studies, WPM 75.
- —3. Fattouh, B. (2007). OPEC Pricing Power: The Need for a New Perspective. Oxford Institute for Energy Studies.
- —4. Fattouh, B. and Mahadeva, L. (2013). OPEC: What Difference Has It Made? Annual Review of Resource Economics, 5.
- —5. Oil & Gas Journal (30 Nov 2025). OPEC+ keeps output increase on hold, approves new quota system. https://www.ogj.com/general-interest/economics-markets/news/55335746/opec-keeps-output-increase-on-hold-approves-new-quota-system
- —6. Razom (Dec 2025). OPEC+ approves three-month pause in production increases. https://razomua.media/en/news/biznes/opek-zatverdila-trimichnu-pauzu-v-naroshchenni-vidobutku
- —7. Engine (2 Nov 2026). OPEC+ decides to keep output steady in December. https://engine.online/news/opec-decides-to-keep-output-steady-in-december-837c
- —8. GMA News/Reuters (4 Oct 2026). OPEC+ agrees to keep November oil output targets steady. https://www.gmanetwork.com/news/money/economy/1004736/opec-agrees-to-keep-november-oil-output-targets-steady/story/
- —9. OPEC (1 Nov 2026). Seven OPEC+ countries reaffirm commitment to market stability. Press release. https://www.opec.org/pr-detail/2033620-1-november-2026.html
- —10. The New Arab (Mar 2026). IEA says oil shock "largest supply disruption" in history. https://www.newarab.com/news/iea-says-oil-shock-largest-supply-disruption-history
- —11. WorldPorts (May 2026). Strait of Hormuz crisis triggering record contraction of global oil inventories. https://www.worldports.org/strait-of-hormuz-crisis-triggering-record-contraction-of-global-oil-inventories/
- —12. Al Jazeera (28 Apr 2026). UAE leaves OPEC in blow to oil cartel during war on Iran. https://www.aljazeera.com/news/2026/4/28/uae-leaves-opec-and-opec
- —13. Associated Press via ABC13 (28 Apr 2026). United Arab Emirates says it will leave OPEC effective May 1. https://abc13.com/story/united-arab-emirates-says-will-leave-opec-effective-may-1/18986097/
- —14. Energy Institute, New Energy World (2026). UAE leaves OPEC and OPEC+. https://ei-dev.energyinst.org/knowledge/new-energy-world/article?id=150285
- —15. Geopolitical Monitor (2026). Russia's shadow fleet and seaborne oil exports. https://www.geopoliticalmonitor.com/?p=56841
- —16. Novaya Gazeta Europe (15 Jan 2026). EU lowers price cap on Russian oil as shadow fleet continues to flout international sanctions. https://novayagazeta.eu/en/articles/2026/01/15/eu-lowers-price-cap-on-russian-oil-as-shadow-fleet-continues-to-flout-international-sanctions-en-news
- —17. Outlook Business (Nov 2025). India's spend on Russian oil at €2.5 bn in Oct ahead of new sanctions. https://www.outlookbusiness.com/markets/indias-spend-on-russian-oil-buy-at-25-bn-euro-in-oct-ahead-of-new-sanctions
- —18. Argus Media (20 Jan 2026). EU oil sanctions: impact on the oil market. https://www.argusmedia.com/en/news-and-insights/market-opinion-and-analysis-blog/eu-oil-sanctions-impact-oil-market
- —19. Ministry of Energy of Ukraine (Feb 2026). Sanctions restrictions in the energy sector: monitoring report, January 2026. https://www.mev.gov.ua/sites/default/files/2026-02/sanctions-monitoring-report-january-2026-rst-mev-eng.pptx-1.pdf
- —20. CREA (Nov 2026). October 2026: monthly analysis of Russian fossil fuel exports and sanctions. https://energyandcleanair.org/?p=17335
- —21. KSE Institute (2026). Russian Oil Tracker, January 2026 data. https://sanctions.kse.ua/?p=12992
- —22. India Seatrade News (Aug 2026). India's Russian crude imports hit record 2.8 million bpd in July (citing CREA). https://indiaseatradenews.com/?p=152174
- —23. KSE Institute (1 Jul 2026). Russia ramps up crude exports after refinery strikes. Russian Oil Tracker. https://sanctions.kse.ua/?p=13262
- —24. Nation Thailand (4 Nov 2026). Brent falls 1% on November 3 amid hopes for peace deals. https://www.nationthailand.com/news/world/40073076
- —25. Enerdata (Jul 2026). The US remained the world's largest crude oil producer in 2025, EIA reports. https://www.enerdata.net/publications/daily-energy-news/us-remained-worlds-largest-crude-oil-producer-2025-eia-reports.html
- —26. Kleinberg, R., Paltsev, S., Ebinger, C., Hobbs, D. and Boersma, T. (2016). Tight Oil Development Economics: Benchmarks, Breakeven Points, and Inelasticities. MIT Center for Energy and Environmental Policy Research.
- —27. Oil & Gas Journal (Sep 2026). EIA forecasts continued growth in US crude oil production through 2026. https://www.ogj.com/drilling-production/news/55404166/eia-forecasts-continued-growth-in-us-crude-oil-production-through-2026
- —28. US Energy Information Administration (10 Sep 2026). United States on track for record crude oil production in 2026. Today in Energy. https://www.eia.gov/todayinEnergy/detail.php?id=68125
- —29. Value the Markets (2026). US oil hits record highs, but can it last? https://www.valuethemarkets.com/analysis/us-oil-hits-record-highs-but-can-it-last
- —30. GCN (24 Jul 2026). U.S. crude oil production hit a record 13.6 million barrels per day in 2025, EIA confirms. https://gcn.com/?p=19997
- —31. PTI via TaxTMI (17 Oct 2025). India's Russian oil import rebound in Oct after dip in previous quarter. https://www.taxtmi.com/news?id=59143
- —32. NewsBytes (14 Nov 2026). Global oil supply has returned to surplus, says IEA. https://www.newsbytesapp.com/news/business/global-oil-supply-exceeds-demand-for-1st-time-since-iran-war/story
- —33. Nation Thailand (10 Nov 2026). Brent losses top US$7 a barrel after November 9 settlement. https://www.nationthailand.com/news/world/40073309
- —34. Nation Thailand (3 Nov 2026). Oil falls over 7% on November 2 amid Iran peace hopes. https://www.nationthailand.com/news/world/40073041
- —35. Hydrocarbon Engineering (26 Oct 2026). IEA: the latest developments in oil markets. https://hydrocarbonengineering.com/refining/26102026/iea-the-latest-developments-in-oil-markets/
- —36. WorldPorts (Jun 2026). From supply shock to oil glut: IEA flags scale of demand destruction caused by Iran war. https://www.worldports.org/?p=759392
- —37. Webull News (2026). India keeps buying Russian oil at near-record pace despite expired waiver. https://www.webull.com.au/news-detail/15264860429558784
- —38. S&P Global Commodity Insights (6 Mar 2026). US issues 30-day waiver to allow sale of already loaded Russian oil to India. https://www.spglobal.com/energy/en/news-research/latest-news/crude-oil/030626-us-issues-30-day-waiver-to-allow-sale-of-already-loaded-russian-oil-to-india
- —39. Free Malaysia Today/Reuters (12 Mar 2026). Iran war is causing biggest-ever oil market disruption, says IEA. https://www.freemalaysiatoday.com/category/highlight/2026/03/12/iran-war-is-causing-biggest-ever-oil-market-disruption-says-iea
- —40. S&P Global Commodity Insights (2 Feb 2026). US, India reach trade deal; Modi to stop Russian oil imports: Trump. https://www.spglobal.com/energy/en/news-research/latest-news/crude-oil/020226-us-india-reach-trade-deal-modi-to-stop-russian-oil-imports-trump
- —41. Oman Observer/Reuters (2026). India exports Russian-free jet fuel. https://www.omanobserver.om/article/1183920/business/india-exports-russian-free-jet-fuel
- —42. S&P Global Commodity Insights (3 Jan 2026). Factbox: Venezuela's oil industry is operating after US seizes Maduro. https://www.spglobal.com/energy/en/news-research/latest-news/crude-oil/010326-factbox-venezuelas-oil-industry-is-operating-after-us-seizes-maduro
- —43. TASS (Nov 2026). India's imports of Russian crude rose 10% in October 2026 (citing CREA). https://tass.com/economy/2217021
- —44. S&P Global Commodity Insights (Nov 2026). India's crude imports hit record high in October. https://www.spglobal.com/energy/en/news-research/latest-news/crude-oil/110326-indias-crude-imports-hit-record-high-in-oct-as-refiners-stock-up-for-festivals-product-exports
- —45. India TV News (7 Feb 2026). US lifts additional 25% tariff on India after New Delhi commits to stop buying Russian oil. https://www.indiatvnews.com/news/world/us-lifts-additional-25-per-cent-tariff-on-india-after-new-delhi-commits-to-stop-buying-russian-oil-2026-02-07-1029231
- —46. Middle East Forum (2026). India's pivot to Russian crude amid Middle East turmoil. https://www.meforum.org/mef-observer/indias-pivot-to-russian-crude-amid-middle-east-turmoil
- —47. ThePrint (31 Jul 2026). Russia's share in India's crude imports hits fresh high in July (Kpler data). https://theprint.in/economy/russias-share-in-indias-crude-imports-hits-fresh-high-in-july-as-refiners-stick-with-urals-crude/3002225/
- —48. Kurs.com.ua, citing Reuters (Aug 2026). Russian oil takes record share of the Indian market. https://kurs.com.ua/en/novost/1474117-rossiiskaja-neft-zahvatila-rekordnuju-dolju-indiiskogo-rinka
- —49. Spherical Insights (Oct 2026). Reliance at the centre of the US–India–Venezuela oil triangle. https://www.sphericalinsights.com/blogs/reliance-at-the-center-of-the-us-india-venezuela-oil-triangle-who-gains-who-loses-expert-view-by-spherical-insights
- —50. Siasat, citing CREA (Nov 2026). India's Russian oil imports touch record EUR 6.4 billion in October. https://www.siasat.com/indias-russian-oil-imports-touch-record-eur-6-4-billion-in-october-3575259/
- —51. Outlook Business (Oct 2026). Jamnagar: the refinery at the centre of Trump's oil strategy. https://www.outlookbusiness.com/news/jamnagar-the-refinery-at-the-centre-of-trumps-oil-strategy
- —52. Voz Pópuli (2026). The world's largest refinery can swallow 1.4 million barrels a day. https://www.vozpopuli.com/indux/en/the-worlds-largest-refinery-can-swallow-1-4-million-barrels-a-day-and-jamnagar-shows-why-oil-still-rewards-absurd-scale/6285/
- —53. Baird Maritime/Reuters (Feb 2026). India's Reliance ships jet fuel cargo to Europe after Russian oil curbs. https://www.bairdmaritime.com/amp/story/shipping/tankers/indias-reliance-ships-jet-fuel-cargo-to-europe-after-russian-oil-curbs
- —54. Deccan Chronicle/PTI (18 Oct 2026). Jamnagar refinery ships six of seven Russian crude-linked cargoes to EU. https://www.deccanchronicle.com/amp/business/economics/jamnagar-refinery-ships-six-of-seven-russian-crude-linked-cargoes-to-eu-1996862
- —55. Upstox, citing CREA (Nov 2026). India's Russian oil imports hit record EUR 6.4 bn in Oct. https://upstox.com/news/business-news/latest-updates/india-s-russian-oil-imports-hit-record-eur-6-4-bn-in-oct-crude-accounts-for-91/article-203369/
- —56. Business Standard (13 Feb 2026). Reliance Industries gets US licence to directly buy Venezuela crude oil. https://www.business-standard.com/economy/news/ril-gets-us-license-to-buy-venezuelan-crude-oil-126021301510_1.html
- —57. Business Today (13 Feb 2026). RIL wins US licence for Venezuelan oil. https://www.businesstoday.in/amp/markets/stocks/story/ril-wins-us-licence-for-venezuelan-oil-says-report-what-you-need-to-know-516054-2026-02-13
- —58. S&P Global Commodity Insights (22 Oct 2026). India's Reliance says open to partnering with US companies in oil, new energy. https://www.spglobal.com/energy/en/news-research/latest-news/crude-oil/102226-indias-reliance-says-open-to-partnering-with-us-companies-in-oil-new-energy
- —59. Outlook Business (Oct 2025). India's Russian oil imports rebound in October after dip in previous quarter. https://www.outlookbusiness.com/economy-and-policy/indias-russian-oil-import-rebound-in-oct-after-dip-in-previous-quarter
- —60. Basis Point Insight, citing GTRI (Aug 2026). Russia now supplies more than half of India's crude-oil imports. https://basispointinsight.com/Story/Economy/russia-now-supplies-more-than-half-of-india-s-crude-oil-imports--says-gtri_b937872d9797.html
- —61. India Briefing (Mar 2026). Navigating the 2026 Hormuz blockade: the US 30-day Russian oil waiver for India. https://www.india-briefing.com/news/us-india-russian-oil-waiver-hormuz-2026-43239.html/
- —62. Argus Media (11 Sep 2026). Hormuz oil export losses near 2.8bn bl: IEA. https://www.argusmedia.com/en/news-and-insights/latest-market-news/2876612-hormuz-oil-export-losses-near-2.8bn-bl-iea
- —63. Offshore Engineer (2 Nov 2026). Oil prices tumble nearly 4% as US-Iran peace hopes grow. https://www.oedigital.com/amp/news/544055-oil-prices-tumble-nearly-4-as-us-iran-peace-hopes-grow
- —64. Enerdata (Mar 2026). US grants one-month waiver for India's Russian oil import amid Middle East crisis. https://www.enerdata.net/publications/daily-energy-news/us-grants-one-month-waiver-indias-russian-oil-import-amid-middle-east-crisis.html
- —65. Business Today (8 Jan 2026). Reliance eyes Venezuelan oil comeback after halting imports in 2025. https://www.businesstoday.in/latest/corporate/story/reliance-eyes-venezuelan-oil-comeback-after-halting-imports-in-2025-report-510117-2026-01-08
- —66. Trading Economics (23 Feb 2026). Brent falls as traders weigh Iran nuclear prospects. https://tradingeconomics.com/commodity/brent-crude-oil/news/527564
- —67. Report.az (19 Mar 2026). Brent crude price exceeds $116. https://report.az/en/amp/energy/brent-oil-falls-to-80-54-per-barrel
- —68. Nation Thailand (14 Nov 2026). Brent and WTI set for losses of about 2.5% in week to Nov 13. https://www.nationthailand.com/news/world/40073488
- —69. Quartz (Mar 2026). Iran war: Middle East oil market disruption, IEA. https://qz.com/iran-middle-east-war-oil-market-disruption-iea
- —70. Kilian, L. (2014). Oil Price Shocks: Causes and Consequences. Annual Review of Resource Economics, 6, 133–154.
- —71. Fattouh, B. (2004). The Investment Challenge for Oil Producing Countries. Middle East Economic Survey, XLVII(38).
- —72. Smith, J. L. (2003). Inscrutable OPEC? Behavioral Tests of the Cartel Hypothesis. SSRN Working Paper 353140.
- —73. Krichene, N. (2002). World crude oil and natural gas: a demand and supply model. Energy Economics, 24(6), 557–576.
- —74. Fattouh, B. (2007). The Drivers of Oil Prices: The Usefulness and Limitations of Non-Structural Models, Supply-Demand Frameworks, and Informal Approaches. EIB Papers, European Investment Bank.
- —75. Hvozdyk, L. and Mercer-Blackman, V. (2010). What Determines Investment in the Oil Sector? A New Era for National and International Oil Companies. Inter-American Development Bank Working Paper.
- —76. Macrotrends (2018). Crude Oil Prices: 70 Year Historical Chart. https://www.macrotrends.net/1369/crude-oil-price-history-chart
- —77. OPEC (2008). Press release on the 151st Meeting of the OPEC Conference, Oran, December 2008.
- —78. Wang, Q., Chen, X., Jha, A. N. and Rogers, H. (2014). Natural gas from shale formation: the evolution, evidences and challenges of shale gas revolution in United States. Renewable and Sustainable Energy Reviews, 30, 1–28.
- —79. Alonso Álvarez, I. and Di Nino, V. (2017). The oil market in the age of shale oil. ECB Economic Bulletin, Issue 8.
- —80. International Monetary Fund (2018). Regional Economic Outlook: Middle East, North Africa, Afghanistan and Pakistan. Fiscal breakeven oil prices.
- —81. Reuters (2016). Breakeven cost of oil production per barrel by country, as reproduced in the author's 2018 study.
- —82. International Monetary Fund (2018). World Economic Outlook.
- —83. OPEC (2017). World Oil Outlook 2040. Vienna: OPEC.
- —84. BP (2018). BP Statistical Review of World Energy 2018, 67th edition.
- —85. US Energy Information Administration (2018). Short-Term Energy Outlook: Venezuela crude oil production.
- —86. Golombek, R., Irarrazabal, A. A. and Ma, L. (2018). OPEC's market power: An empirical dominant firm model for the oil market. Energy Economics, 70, 98–115.
- —87. Brandt, A. R., Millard-Ball, A., Ganser, M. and Gorelick, S. M. (2013). Peak Oil Demand: The Role of Fuel Efficiency and Alternative Fuels in a Global Oil Production Decline. Environmental Science & Technology, 47(14), 8031–8041.
- —88. Fattouh, B. OPEC Pricing Power. Presentation, Oxford Institute for Energy Studies (source of Figure 1).
- —89. US Federal Reserve, Broad price-adjusted US dollar index, via Macrotrends (source of Figure 4).
- —90. US Energy Information Administration and Oxford Economics. Non-OECD liquid fuels consumption and GDP (source of Figure 3).
- —91. BOE Report/Reuters (2 Feb 2026). Venezuela's oil exports bounce to 800,000 bpd in January under US control. https://boereport.com/2026/02/02/venezuelas-oil-exports-bounce-to-800000-bpd-in-january-under-us-control-shipping-data/
- —92. BP (2015). BP Statistical Review of World Energy 2015: oil production and consumption, 2004–2014. https://www.ourenergypolicy.org/wp-content/uploads/2015/06/bp-statistical-review-of-world-energy-2015-full-report-1.pdf
- —93. Energy Institute (2026). Statistical Review of World Energy 2026, 75th edition. https://www.energyinst.org/__data/assets/file/0004/1827616/Statistical-Review-of-World-Energy-PDF-Report.pdf
- —94. Federal Reserve Bank of St. Louis, FRED. Real Broad Dollar Index (RTWEXBGS), monthly and annual averages. https://fred.stlouisfed.org/series/RTWEXBGS
- —95. International Monetary Fund. DataMapper: real GDP growth, emerging market and developing economies (World Economic Outlook). https://www.imf.org/external/datamapper/NGDP_RPCH@WEO/OEMDC
- —96. Oil & Gas Journal (Jun 2016). BP: Oil gained global market share in 2015 for first time in 16 years. https://www.ogj.com/articles/2016/06/bp-oil-gained-global-market-share-in-2015-for-first-time-in-16-years.html
- —97. Gas Processing News (Jun 2016). BP Statistical Review: world shifting to lower-carbon fuels. https://www.gasprocessingnews.com/news/2016/06/bp-statistical-review-world-shifting-to-lower-carbon-fuels
- —98. Energynews.pro (2026). Venezuela oil production of 930,000 barrels per day despite 300 billion in reserves (OPEC secondary sources). https://energynews.pro/en/venezuela-oil-production-of-930000-barrels-per-day-despite-300-billion-in-reserves/
- —99. Industrial Info Resources (2026). How sustainable is Venezuela's oil recovery? https://www.industrialinfo.com/news/article/how-sustainable-is-venezuelas-oil-recovery--361833
- —100. US Energy Information Administration (Jun 2022). Global Surplus Crude Oil Production Capacity, 1970–2021. https://www.eia.gov/international/content/analysis/special_topics/Global_Surplus_Crude_Oil_Production_Capacity/full-report.pdf
- —101. US Energy Information Administration (2025). Today in Energy: OPEC+ production and surplus capacity. https://www.eia.gov/todayinenergy/detail.php?id=64565
Sourav Chakraborty is an entrepreneur, Indian history researcher, political observer and columnist. An alumnus of Imperial College London and Boston University, he holds the DIC, FRSA, FRAS, CEng (IET & IEI) and CMgr (MCMI).
The views expressed in this piece are the author's own. Global Outlook publishes contributed opinion as a platform and does not necessarily endorse it.
If this piece was useful, subscribe for the right take on global affairs and expert opinions. It is free.
Read more on India
A Quicker Recovery: Why India Is Weathering the Global Market Shocks
With 7% growth, a young workforce and two sovereign upgrades behind it, India's market has held up while the US, China and Brazil lurch.
08 Nov 2026A diya in every embassy: How India uses Diwali to bring home to its diaspora
From the first indentured ship to reach Mauritius to a floating holiday at the UN, Diwali has travelled with India's diaspora. Today, India's missions abroad are helping turn it into a bridge between that diaspora, the countries it lives in, and home
09 Oct 2026India's Labour Data Has No Category for Gig Workers
Gig workers are now covered by the Code on Social Security, yet the PLFS, e-Shram and Census 2027 do not identify platform work. Four changes would fix that.